Basic modification statistics
For an introduction to basic modification statistics, see Data tracking solutions.
You can view and export basic statistics for a modification in the Frosmo Control Panel.
For information about viewing and exporting advanced tracking statistics, see Advanced tracking statistics.
Basic performance metrics
Based on the basic events and conversions tracked for a modification, the Frosmo Platform automatically calculates the following basic performance metrics for the modification:
-
Click-through rate (CTR): The ratio of clicks to displays or true displays. The platform tracks CTR separately for displays and true displays.
-
Conversion rate (CR): The percentage of all visitors that completed a conversion (either a transaction or a non-purchase conversion) after clicking or seeing the modification. The platform tracks CR separately for clicks, displays, and true displays.
-
Total revenue: Total revenue attributed to the modification after the modification was clicked or displayed. The platform tracks total revenue separately for clicks, displays, and true displays.
Viewing basic modification statistics
You can view:
-
Changes in a selected statistic over time (chart)
-
Key visitor metrics based on displays
-
Modification event counts and metrics based on displays, true displays, and clicks
Unique counts are calculated by visitor rather by individual event. For example, if the same modification variation is displayed to a visitor seven times, that counts as seven displays and one unique display for that variation.
If a modification has the comparison group enabled, and if the modification targets only specific deciles, the comparison group statistics for the modification only include visitor data from those deciles.
To view the basic statistics for a modification:
-
In the Frosmo Control Panel, in the sidebar, select Modifications.
-
In the modifications list, find the modification whose statistics you want to view.
-
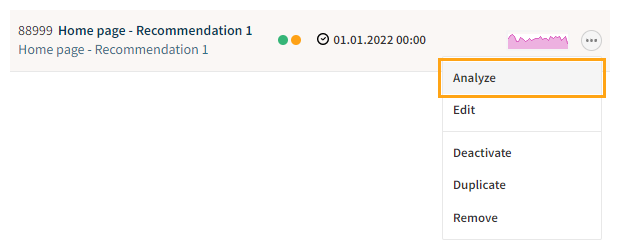
Click the quick menu button for the modification, and select Analyze.
-
In the modification statistics view, in the Start date and End date fields, select the time range for which you want to view the statistics.
-
In the Conversion type field, select the conversion type for which to view the statistics. To only view transaction statistics, select Transaction. To view the combined statistics for all conversion types, select All.
-
Click Show.

-
View the statistics:
-
Chart (statistics over time)
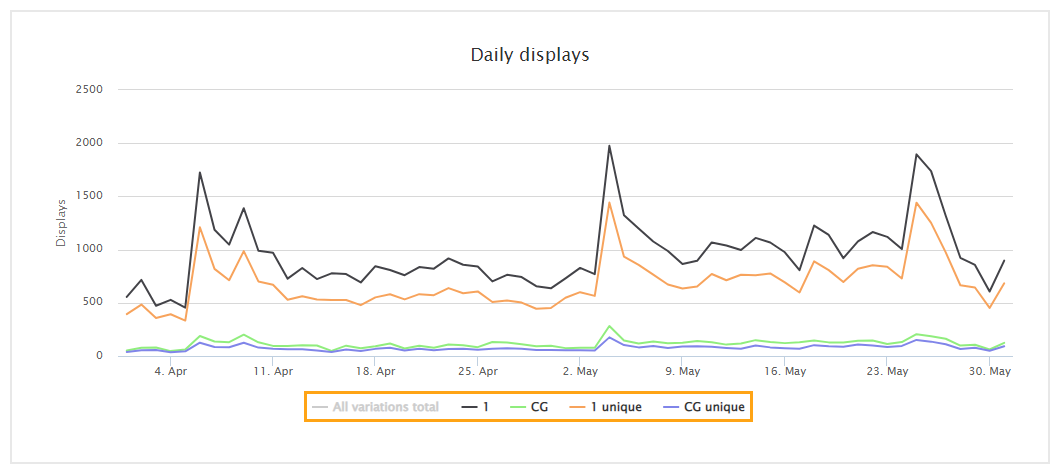
By default, the chart shows the daily displays and unique displays for the modification over the selected time range. You can select a daily, weekly, or monthly view for the chart. You can also select which statistic to show in the chart. Selecting a cumulative version of a statistic shows a cumulative line chart for the statistic with the value summed over time.
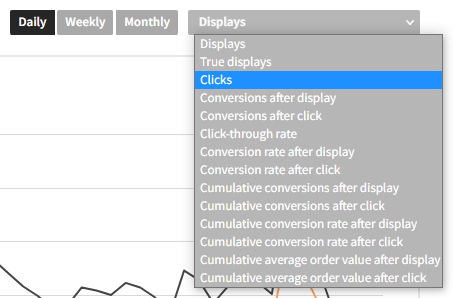
Average order value means the average value (normally, revenue) of the conversions attributed to the modification after the modification was clicked or displayed.
You can further refine the chart by selecting to show only specific variations (including the comparison group, if enabled), either the full or unique counts for the statistic, and annotations, if any. To show or hide a value, click its selector below the chart.
-
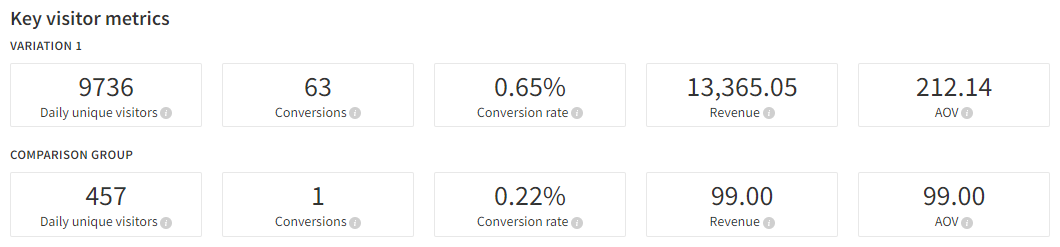
Key visitor metrics
The key visitor metrics are based on displays and calculated separately for each variation (including the comparison group, if enabled).
noteRevenue is calculated from the individual item prices (rather than from the total purchase value) recorded in the transactions attributed to a variation.
-
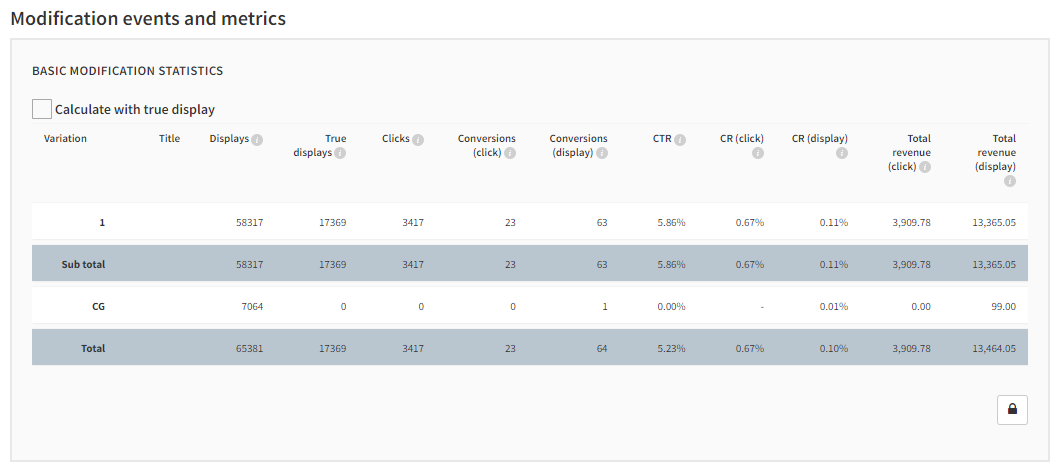
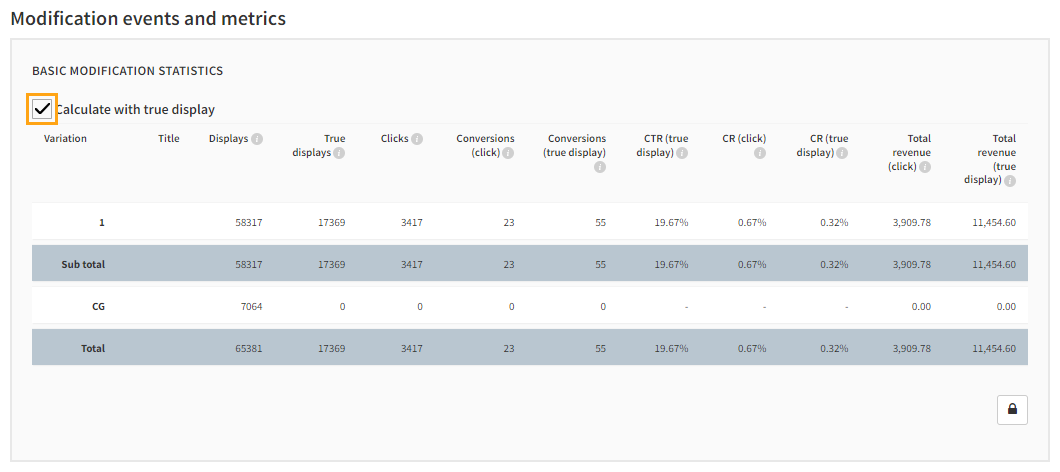
Modification events and metrics
The events and metrics are tracked separately for each variation (including the comparison group, if enabled). The total counts by event or metric are listed at the bottom of the table.
By default, the cumulative statistics are based on displays. If you want to calculate the statistics based on true displays, select Calculate with true display. The following figures show the same statistics calculated based on displays and true displays, respectively.
-
Downloading basic modification statistics
You can download a report of the following basic statistics for a modification:
-
Displays and unique displays
-
True displays and unique true displays
-
Clicks and unique clicks
-
Conversions after click
-
Conversions after display
-
CTR for displays
-
CR for clicks
-
CR for displays
-
Average order value for clicks
-
Average order value for displays
A report file is generated and downloaded to your computer. The file is in the Microsoft Office Open XML Workbook (XLSX) format.
Unique counts are calculated by visitor rather by individual event. For example, if the same modification variation is displayed to a visitor seven times, that counts as seven displays and one unique display for that variation.
Average order value means the average value (normally, revenue) of the conversions attributed to the modification after the modification was clicked or displayed.
To download the basic statistics report for a modification:
-
In the Frosmo Control Panel, in the sidebar, select Modifications.
-
In the modifications list, find the modification whose statistics you want to view.
-
Click the quick menu button for the modification, and select Analyze. The modification Statistics views opens.
-
In the Start date and End date fields, select the time range for which you want to view the statistics.
-
In the Conversion type field, select the conversion type for which to view the statistics. To only view transaction statistics, select Transaction. To view the combined statistics for all conversion types, select All.
-
Click Show.
-
Select a daily, weekly, or monthly view, depending on how you want to aggregate the statistics in the export.
-
Click Download statistics report.
You've downloaded the statistics report. You can find the report file in your browser's default download location.