Conversion statistics
You can view and export conversion statistics for a site in the Frosmo Control Panel. The statistics include both transactions and non-purchase conversions.
Use the statistics to:
-
Monitor the number of conversions driven by the Frosmo Platform.
-
Monitor the revenue generated by those conversions.
You can quickly check the most important business performance statistics in the site dashboard.
Conversions at a glance
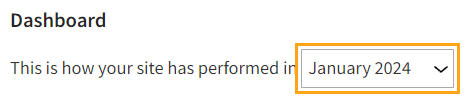
To view a summary of the most important conversion statistics for a past month:
-
In the Frosmo Control Panel, in the sidebar, select Dashboard.
-
If your site uses the redesigned dashboard, click View more statistics.
-
In the time range field, select either Last 30 days or a past month.
-
In the conversion type field, select all if you want to view the total conversion numbers, or select a specific conversion type if you want to view the numbers only for that conversion type. To only view transactions, select transaction.

If you selected a past month in the previous step, the UI shows the conversion rate change from the month preceding the selected month.
-
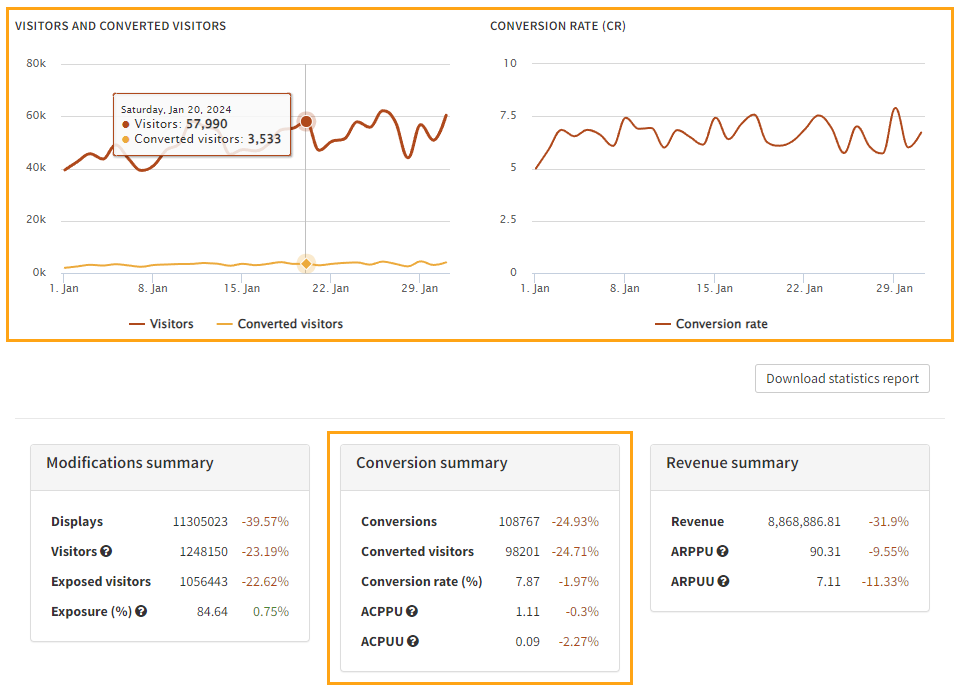
Study the statistics:
-
Visitors and converted visitors
-
The chart plots the number of daily visitors and the number of daily converted visitors over the selected time range and for the selected conversion type.
-
The chart only shows unique visitors. If the same visitor visits the site multiple times during a given day, they count as one visitor for that day. Similarly, if the same visitor completes multiple conversions during a given day, they count as one converted visitor for that day.
-
To view the exact daily numbers, hover your mouse cursor over the chart.
-
-
Conversion rate (CR)
-
The chart plots the conversion rate over the selected time range and for the selected conversion type.
-
To view the exact daily numbers, hover your mouse cursor over the chart.
-
-
Conversion summary
-
Conversions: Total number of conversions
-
Converted visitors: Total number of converted visitors
-
Conversion rate (%): Percentage of visitors who have converted
-
ACPPU: Average number of conversions per paying visitor
-
ACPUU: Average number of conversions per unique visitor
In addition to the statistics, the summary shows the change from the previous month.
-
-
-
To download the Visitors and converted visitors and Conversion rate (CR) charts as a PDF file, click Download statistics report.
Viewing detailed conversion statistics
To view detailed conversion statistics:
-
In the Frosmo Control Panel, in the sidebar, select More > All Reports.
-
Select the Conversions tab.
-
Define the time range over which you want to view the statistics:
-
Weekly view: Select Week, and use the date picker to select any date from the week that you want to view. If you select a date that is not a Monday, the date field automatically sets itself to the Monday of the selected week.
-
Monthly view: Select Month, and use the date picker to select any date from the month that you want to view. If you select a date other than the 1st, the date field automatically sets itself to the 1st of the selected month.
-
Custom view: Select Custom, and use the date pickers to select the start and end dates of the time range you want to view.
 info
infoIn the Frosmo Platform, for statistics purposes, a week starts on Monday at 00:00:00 and ends on Sunday at 23:59:59, while a month starts on the 1st of the month at 00:00:00 and ends on the last day of the month at 23:59:59.
The times always use the time zone of your Frosmo Platform instance. Your current time zone may therefore differ from the time zone that the statistics use.
-
-
Optionally, filter the statistics by segment and conversion type:
-
Segment: Select the segment for which to view the statistics. To view the combined statistics for all segments, select All.
-
Conversion type: Select the conversion type for which to view the statistics. To only view transaction statistics, select Transaction. To view the combined statistics for all conversion types, select All.

-
-
Study the statistics:
-
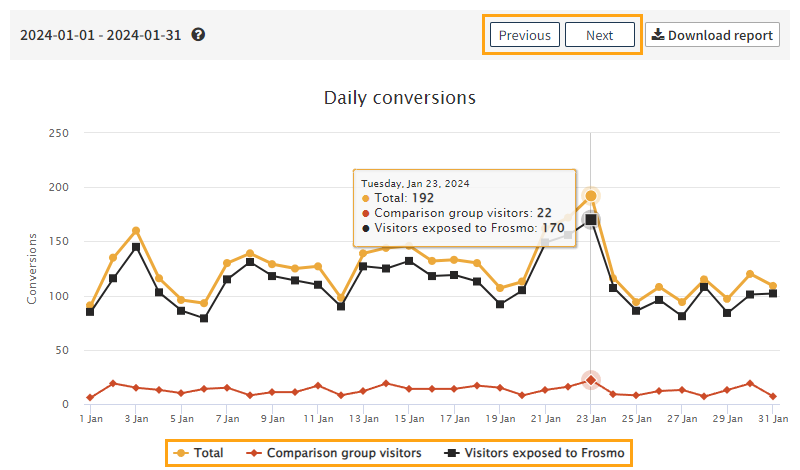
In a weekly or monthly view, to view the statistics for an adjacent week or month, click Previous or Next.
-
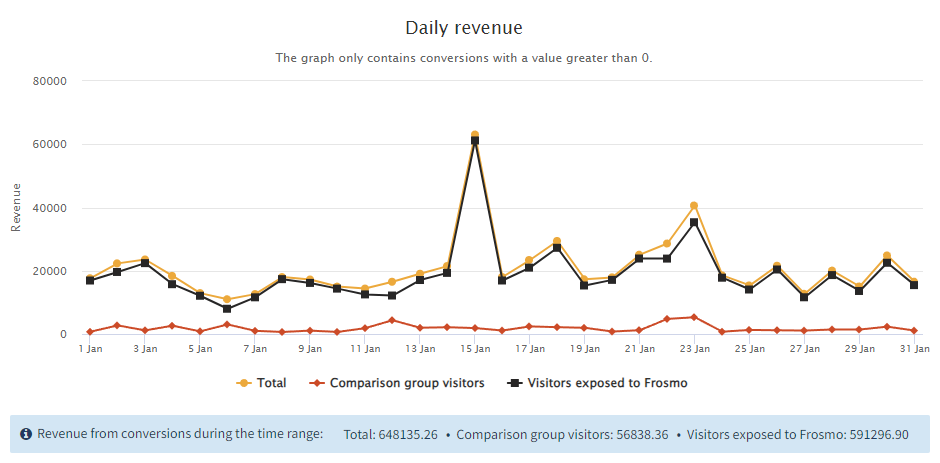
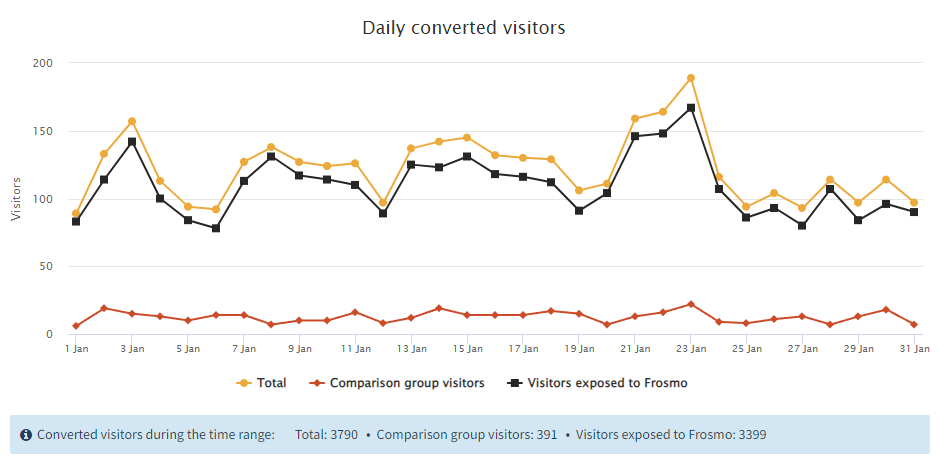
The daily charts plot the data using the following lines:
-
Total: Total number of conversions by all visitors
-
Comparison group visitors: Total number of conversions by visitors in the comparison group
-
Visitors exposed to Frosmo: Total number of conversions by visitors not in the comparison group
To toggle the visibility of a line, click the line label below the chart.
-
-
To view the exact numbers for a line, hover your mouse cursor over the chart.
-
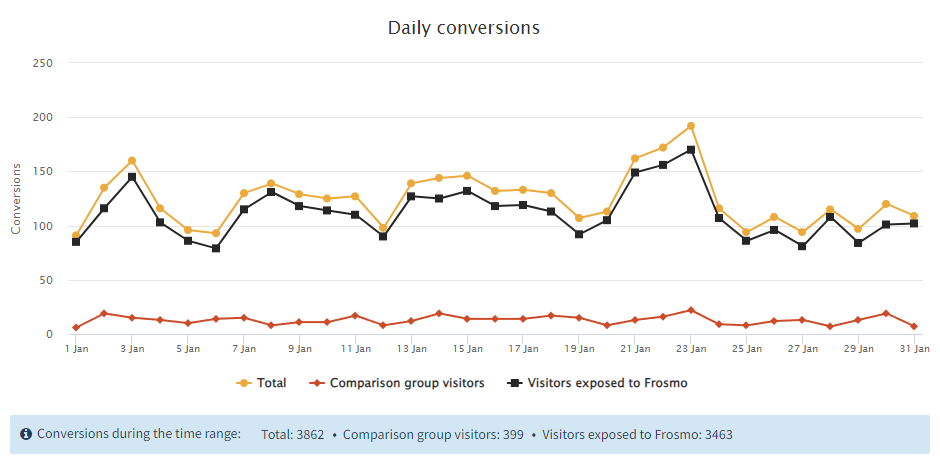
Daily conversions��
The Daily conversions chart plots the number of daily conversions over the selected time range.
Below the chart, you can view the totals for each line for the entire selected time range.
Daily revenue
The Daily revenue chart plots the amount of daily revenue over the selected time range. The revenue comes from transactions and non-purchase conversions that have a positive conversion value.
Below the chart, you can view the totals for each line for the entire selected time range.
The revenue is in whatever currency is used in conversion and transaction tracking on the site. The Frosmo Platform treats currency values as just numbers, meaning the platform does not process the values as currency in any way. For example, if the site uses multiple currencies, the different currency values are mixed as is in the statistics; the platform does not convert the values to the same currency for the statistics.
Daily converted visitors
The Daily converted visitors chart plots the number of converted visitors per day over the selected time range.
Below the chart, you can view the totals for each line for the entire selected time range.
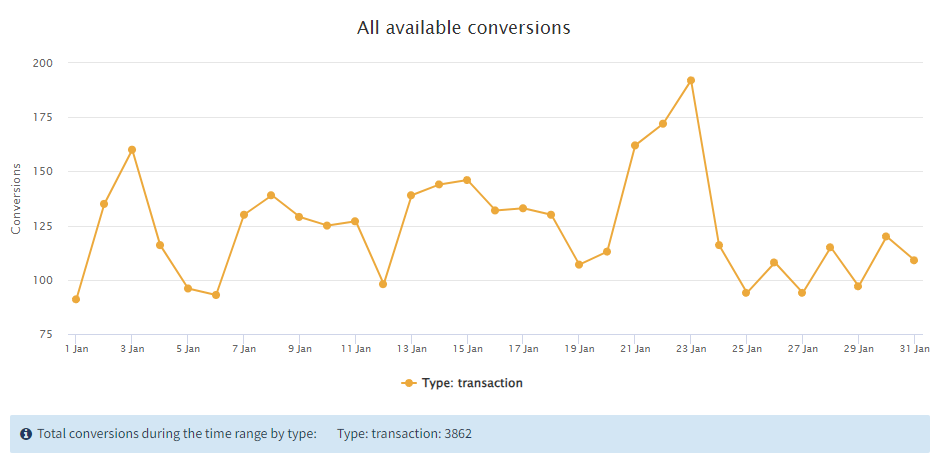
All available conversions
The All available conversions chart plots the number of daily conversions by conversion type over the selected time range.
Below the chart, you can view the totals for each line for the entire selected time range.
Exporting detailed conversion statistics
You can export detailed conversion statistics to a Microsoft Office Open XML Workbook (XLSX) file.
To export the statistics:
-
In the Frosmo Control Panel, in the sidebar, select More > All Reports.
-
Select the Conversions tab.
-
Define the time range and filtering for the statistics. For more information, see steps 3 and 4 in Viewing detailed conversion statistics.
-
Click Download report. Your browser downloads the XLSX file containing the statistics.