Planning visitor journeys
Every company has slightly different goals and plans for its website. When it comes to creating great user experiences and great personalization, though, the basic steps are still the same:
-
Set goals based on what your pain points are, and define hypotheses on how to best address those pain points.
-
Develop your site to achieve the goals:
-
Get data about your visitors to decide what is the best route to reach your goals.
-
Define your audiences, and implement segmentation.
-
Carefully test your ideas, so that you can determine which ideas provide your visitors with an experience that benefits you both. Keep your goals in mind.
-
Turn the best ideas into personalized visitor journeys.
-
-
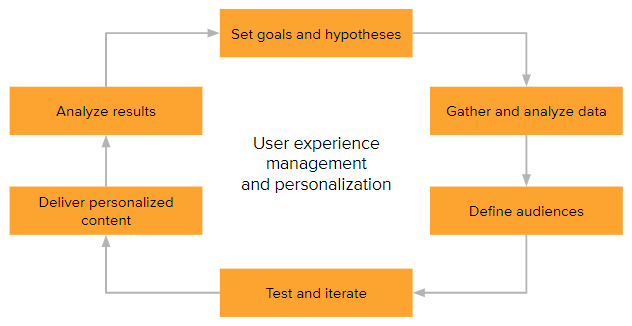
Analyze the results to see whether you are moving in the right direction.
The following figure illustrates the basic user experience management and personalization workflow.
Setting goals
The first thing to think about when planning user experience are your goals. You probably want more conversions, but what does that mean to you, and what can you reasonably expect to achieve? Do you simply want to increase the sales volume in your web store, or do you want to upsell specific products that bring you the best revenue? Or, do you want to engage your visitors by prompting them to sign up for a newsletter? When you define what you want your visitors to do, think about who you are targeting, what you want them to experience, and how to create that experience for them.
These are some common goals for user experience personalization and optimization:
-
Acquire new customers.
-
Encourage transactions.
-
Increase overseas sales.
-
Keep shoppers engaged throughout the purchase funnel.
-
Reduce shopping cart abandonment.
-
Upsell profitable products.
Create hypotheses about how to achieve the goals you select.
Gathering data
After setting your goals, the next step on your roadmap is getting to know your website visitors. You probably have an analytics tool set up for your website to track basic metrics, such as site traffic, traffic sources, page views, new and returning visitors, session duration, and bounce rate.
The more complete your data is, the better you can understand how your visitors behave and what engages, motivates, and attracts them. However, you must think about how the data you collect serves your key performance indicators (KPIs), which are the metrics you want to track and report. Each organization has its own set of KPIs – there is no out-of-the-box solution that fits all.
In addition to the data you receive from other analytics tools, the Frosmo JavaScript library collects usage data in the visitor's browser and sends the data to the Frosmo back end. The data can be categorized as follows:
-
Modification performance data: Basic modification events used for monitoring and reporting
-
Product data: Information about products used in product recommendations
-
Visitor data:
-
Background data: Information about the visitor not related to a specific website
-
Behavior data: Visitor's actions on the website
-
Conversion and transaction data: Visitor's actions on the website in connection with purchases and other conversions
-
Account data: Personal data collected and stored temporarily for the purpose of transferring it to customer's back end systems or third-party systems controlled by the customer
-
For more information, see Data collected from websites.
Some of this data is tracked automatically on your site. Other types you can collect by setting up data tracking for your site and by creating segments to monitor the preferences of your visitors.
You can integrate the Frosmo Platform to your other analytics tools, such as Google Analytics, to create a comprehensive data collection on which to base your development efforts. Combining all your user analytics also helps you to measure the results of those efforts.
Targeting visitors
When you know your visitor types, you can start segmenting them to provide them with content that best serves them.
To create relevant and useful visitor segments, think about your service structure. Which parts, pages, or actions do you value? Does it matter from where the visitor has arrived to your service or which keywords the visitor has used in a search engine?
An example of a good and simple segmentation is creating a segment for visitors who regularly use a specific part of your service. This part can be, for example, a page listing products in a specific category. In this case, you can define that visitors who have visited the category page at least 5 times are included in the segment. You can add as many segmentation rules as you like, for example, segmenting visitors that have visited the category page at least 5 times using a mobile device. You can also segment visitors based on exclusion, for example, segmenting visitors that have visited the category page but not the discount section.
The Frosmo Platform segmentation features include various options for defining segmentation rules, for example:
-
Custom visitor actions defined by you
-
Landing page through which the visitor entered the website
-
New visitor
-
Previously visited sites or pages
You can also combine segments into segment groups to further determine which visitors you want include in your target audience – or leave out of it.
For more information about segmentation, see Feature: Segmentation.
You can also use affinity groups to target content to visitors. You can think of affinity groups as segments that the platform creates and manages automatically.
Creating personalized visitor journeys
A modification is a real-time change to a web page designed to personalize or otherwise improve the user experience of a website and guide visitors to complete a conversion. Personalized modifications are based on visitor attributes that can be either rule-based (segmentation) or data-based (machine learning algorithms).
Personalizing your site with modifications
Here are examples of common modifications:
-
Modify existing content, such as banners.
-
Show personalized content based on the visitor's behavior or context.
-
Add new content, such as product recommendations or content generated from data feeds.
-
Remove unnecessary content, such as distracting elements, site navigation elements in shopping carts, or surplus elements in mobile-optimized layouts.
-
Test the layout and styling of and element or a page.
-
Track specific events, such as conversions or product views, on a page without making visible changes.
-
Use the Frosmo Platform as a tag manager to add custom JavaScript code to your site.
Frosmo provides the following types of modifications:
-
A/B test: Create two or more content variations to test which variation performs best.
-
Multi-armed bandit: Select a multi-armed bandit algorithm that automatically decides the best-performing content variation and adjusts the variation distribution accordingly. For more information, see Multi-armed bandit optimization.
-
Personalization: Create a single piece of content that you can personalize.
The Frosmo Control Panel provides various options to define where and when to make the modification available. You can create the modification content manually or based on a predefined template.
For more information about create modifications, see the modification user guide.
A recommendation is a specific type of modification that is created directly from product data.
Before the modification can be shown to a larger audience, test it to make sure that it works as intended. The Frosmo Platform contains a preview tool you can use to display a modification based on the selected placement. For more information, see Testing.
Measuring your personalized content
You can test visitor reaction to your modification, for example, by defining the variation distribution of a modification so that only some of your visitors get a specific content variation. You can then compare the variations against each other.
The Frosmo Platform automatically places a certain percentage of all visitors in the comparison group. The comparison group consists of visitors who see the original content of a web page instead of modifications. For visitors in the comparison group to see the original content instead of a modification, the modification must have an active comparison group variation. If active, visitors in the comparison group do not see the modification, while visitors not in the comparison group see the modification normally. The comparison group allows you to monitor modification performance as compared to your original content.
You can also track the original page content to measure modification performance.
For more information, see Modification statistics.
Getting results
You have set your goals, segmented your visitors, and provided them with a relevant, personalized user experience – or so you think. How do you know you are actually meeting your goals?
You should now go back to your goals and the analytics to see how your website statistics compare to the key performance indicators (KPIs) you have set. Those KPIs are in line with your long-term goals and provide you immediate feedback on the direction your website traffic is moving.
For example, the main goal of an ecommerce site is simply to create revenue. To do this, the site must encourage visitors to select many products, select expensive products (or products that the site owner wants to upsell), and, most of all, complete purchases. Important KPIs for such a site include:
-
Average purchase value
-
Cart abandonment rate
-
Conversion rate (percentage of visitors that complete a purchase)
-
Number of products per purchase
Other sites may focus on lead generation rather than revenue creation. The main goal for such a site may be to engage visitors and get them to give their contact information by submitting a form. In this case, the following KPIs are important:
-
Conversion rate (percentage of visitors that submit the contact information form)
-
Form abandonment rate
-
Generated leads in a specific time range
-
Number of content downloads (webinars, white papers, videos)
The Frosmo Control Panel allows you to view most of the above statistics and many others, including:
-
Average conversions and revenue per visitor
-
Modification displays
-
Product views
-
Visitor retention (returning visitors)
-
Visitor sources