Visitor statistics
You can view various visitor statistics for a site in the Frosmo Control Panel.
For an introduction to the related concepts of visitor and session, see Visitors and sessions.
Monthly visitors and converted visitors at a glance
To view a summary of the number of visitors and converted visitors for a past month:
-
In the Frosmo Control Panel, in the sidebar, select Dashboard.
-
If your site uses the redesigned dashboard, click View more statistics.
-
In the time range field, select either Last 30 days or a past month.
-
In the conversion type field, select all if you want to view the total visitor numbers, or select a specific conversion type if you want to view the numbers only for that conversion type. To only view transactions, select transaction.

-
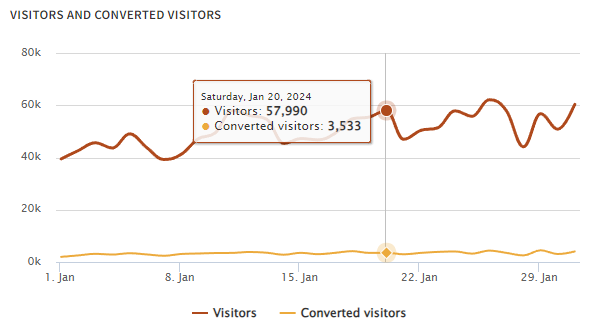
Study the Visitors and converted visitors chart.
-
The chart plots the number of daily visitors and the number of daily converted visitors over the selected time range and for the selected conversion type.
-
The chart only shows unique visitors. If the same visitor visits the site multiple times during a given day, they count as one visitor for that day. Similarly, if the same visitor completes multiple conversions during a given day, they count as one converted visitor for that day.
-
To view the exact daily numbers, hover your mouse cursor over the chart.
-
For more information about viewing conversion statistics, see Conversion statistics.
Daily and monthly visitors and sessions
You can view and export statistics for daily and monthly visitors and sessions in the Frosmo Control Panel.
Viewing statistics for daily and monthly visitors and sessions
To view the number of daily and monthly visitors and sessions:
-
In the Frosmo Control Panel, in the sidebar, select More > All Reports.
-
Select the Traffic tab.
-
Define the time range over which you want to view the statistics:
-
Weekly view: Select Week, and use the date picker to select any date from the week that you want to view. If you select a date that is not a Monday, the date field automatically sets itself to the Monday of the selected week.
-
Monthly view: Select Month, and use the date picker to select any date from the month that you want to view. If you select a date other than the 1st, the date field automatically sets itself to the 1st of the selected month.
-
Custom view: Select Custom, and use the date pickers to select the start and end dates of the time range you want to view.
 info
infoIn the Frosmo Platform, for statistics purposes, a week starts on Monday at 00:00:00 and ends on Sunday at 23:59:59, while a month starts on the 1st of the month at 00:00:00 and ends on the last day of the month at 23:59:59.
The times always use the time zone of your Frosmo Platform instance. Your current time zone may therefore differ from the time zone that the statistics use.
-
-
Optionally, filter the statistics by segment and conversion type:
-
Segment: Select the segment for which to view the statistics. To view the combined statistics for all segments, select All.
noteThe segment filter only applies to the visitor charts. The session charts always show the combined statistics for all segments.
-
Conversion type: Select the conversion type for which to view the statistics. To only view transaction statistics, select Transaction. To view the combined statistics for all conversion types, select All.

-
-
Study the statistics:
-
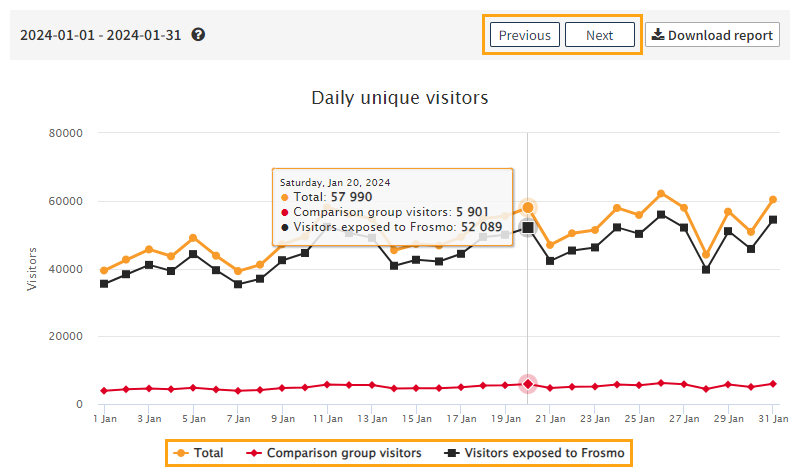
In a weekly or monthly view, to view the statistics for an adjacent week or month, click Previous or Next.
-
The visitor charts plot the data using the following lines:
-
Total: Total number of visitors
-
Comparison group visitors: Total number of visitors in the comparison group
-
Visitors exposed to Frosmo: Total number of visitors not in the comparison group
To toggle the visibility of a line, click the line label below the chart.
-
-
To view the exact numbers for a line, hover your mouse cursor over the chart.
-
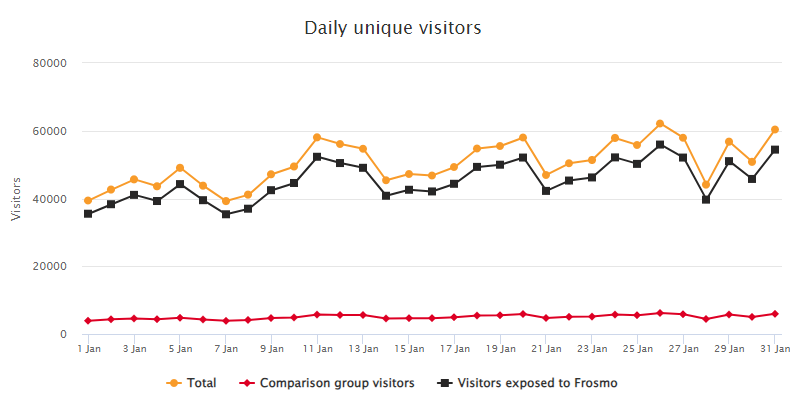
Daily unique visitors
The Daily unique visitors chart plots the number of daily visitors over the selected time range.
The chart only shows unique visitors. If the same visitor visits the site multiple times during a given day, they count as one visitor for that day.
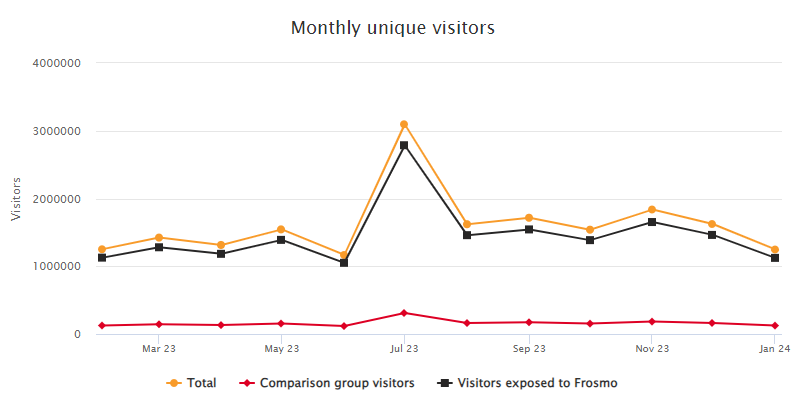
Monthly unique visitors
The Monthly unique visitors chart plots the number of monthly visitors leading up to – and including – the selected month (weekly and monthly views) or the start date month (custom views). The chart goes back 12 months from the current month, not the selected month or the start date month. For example, if the current month is April, the chart starts from May of the previous year.
The chart only shows unique visitors. If the same visitor visits the site multiple times during a given month, they count as one visitor for that month.
Daily sessions
The Daily sessions chart plots the number of daily sessions over the selected time range.
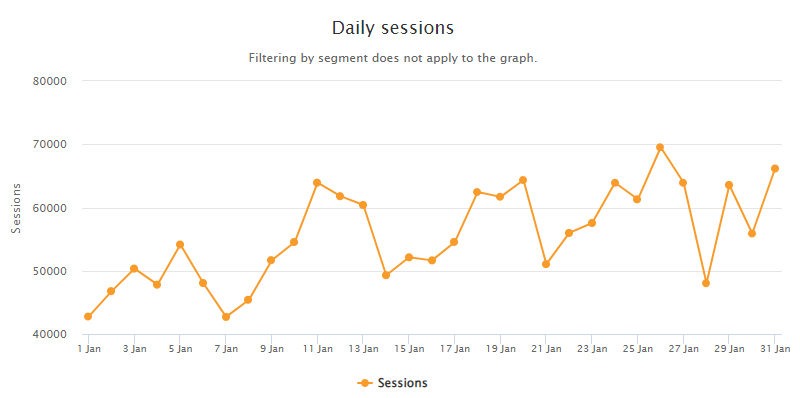
The segment filter does not apply to the session charts. The session charts always show the combined statistics for all segments.
Monthly sessions
The Monthly sessions chart plots the number of monthly sessions leading up to – and including – the selected month (weekly and monthly views) or the start date month (custom views). The chart goes back 12 months from the current month, not the selected month or the start date month. For example, if the current month is April, the chart starts from May of the previous year.
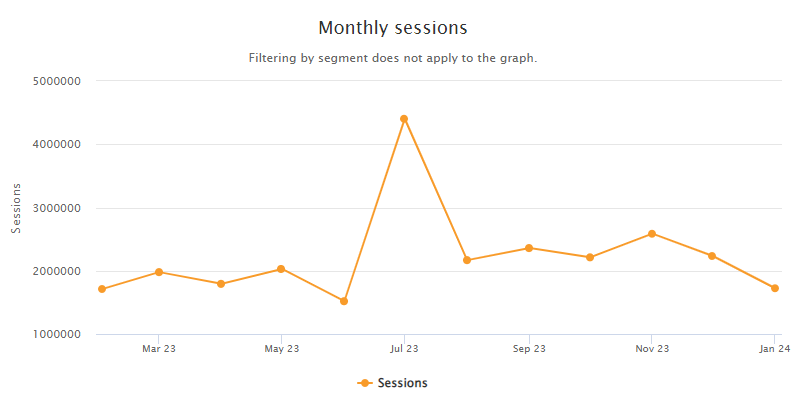
The segment filter does not apply to the session charts. The session charts always show the combined statistics for all segments.
Exporting statistics for daily and monthly visitors and sessions
You can export statistics for daily and monthly visitors and sessions to a Microsoft Office Open XML Workbook (XLSX) file.
To export the statistics:
-
In the Frosmo Control Panel, in the sidebar, select More > All Reports.
-
Select the Traffic tab.
-
Define the time range and filtering for the statistics. For more information, see steps 3 and 4 in Viewing statistics for daily and monthly visitors and sessions.
-
Click Download report. Your browser downloads the XLSX file containing the statistics.
Daily returning and new visitors
You can view and export statistics for daily returning and new visitors in the Frosmo Control Panel.
Viewing statistics for daily returning and new visitors
To view the statistics for daily returning and new visitors:
-
In the Frosmo Control Panel, in the sidebar, select More > All Reports.
-
Select the Retention tab.
-
Define the time range over which you want to view the statistics:
-
Weekly view: Select Week, and use the date picker to select any date from the week that you want to view. If you select a date that is not a Monday, the date field automatically sets itself to the Monday of the selected week.
-
Monthly view: Select Month, and use the date picker to select any date from the month that you want to view. If you select a date other than the 1st, the date field automatically sets itself to the 1st of the selected month.
-
Custom view: Select Custom, and use the date pickers to select the start and end dates of the time range you want to view.
infoIn the Frosmo Platform, for statistics purposes, a week starts on Monday at 00:00:00 and ends on Sunday at 23:59:59, while a month starts on the 1st of the month at 00:00:00 and ends on the last day of the month at 23:59:59.
The times always use the time zone of your Frosmo Platform instance. Your current time zone may therefore differ from the time zone that the statistics use.
-
-
Optionally, filter the statistics by segment and conversion type:
-
Segment: Select the segment for which to view the statistics. To view the combined statistics for all segments, select All.
-
Conversion type: Select the conversion type for which to view the statistics. To only view transaction statistics, select Transaction. To view the combined statistics for all conversion types, select All.
-
-
Study the statistics:
-
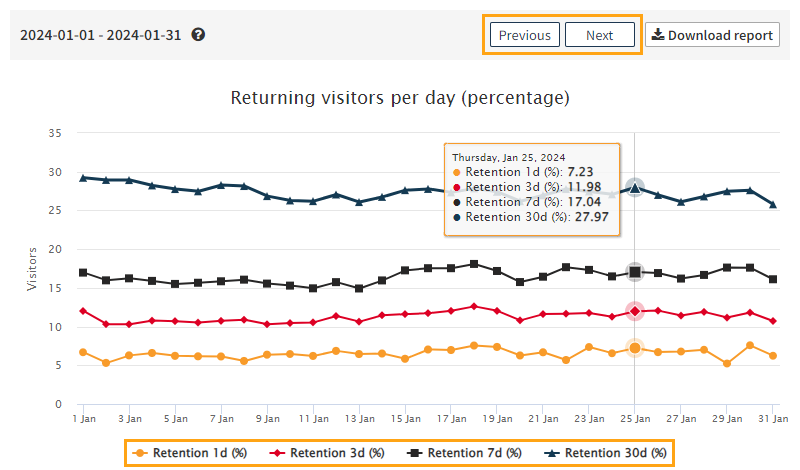
In a weekly or monthly view, to view the statistics for an adjacent week or month, click Previous or Next.
-
The charts only show unique visitors. If the same visitor visits the site multiple times during a given day, they count as one visitor for that day.
-
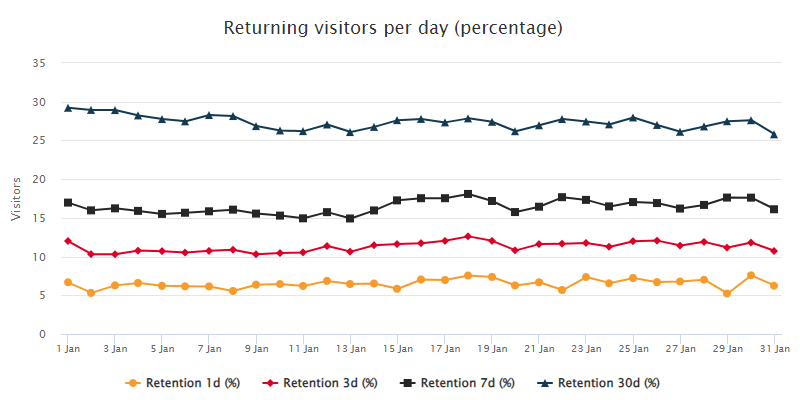
The returning visitor charts plot the data using the following lines:
-
Retention 1d: Returning visitors from the previous day. These visitors visited the site at least once on the previous day.
-
Retention 3d: Returning visitors from the past three days. These visitors visited the site at least once during the past three days.
-
Retention 7d: Returning visitors from the past seven days. These visitors visited the site at least once during the past seven days.
-
Retention 30d: Returning visitors from the past 30 days. These visitors visited the site at least once during the past 30 days.
To toggle the visibility of a line, click the line label below the chart.
-
-
To view the exact numbers for a line, hover your mouse cursor over the chart.
-
Returning visitors per day (percentage)
The Returning visitors per day (percentage) chart plots the percentage of daily returning visitors (share of all daily visitors) over the selected time range.
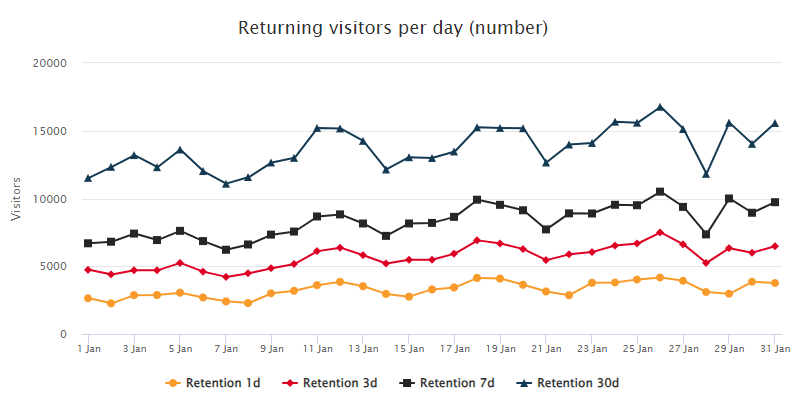
Returning visitors per day (number)
The Returning visitors per day (percentage) chart plots the number of daily returning visitors over the selected time range.
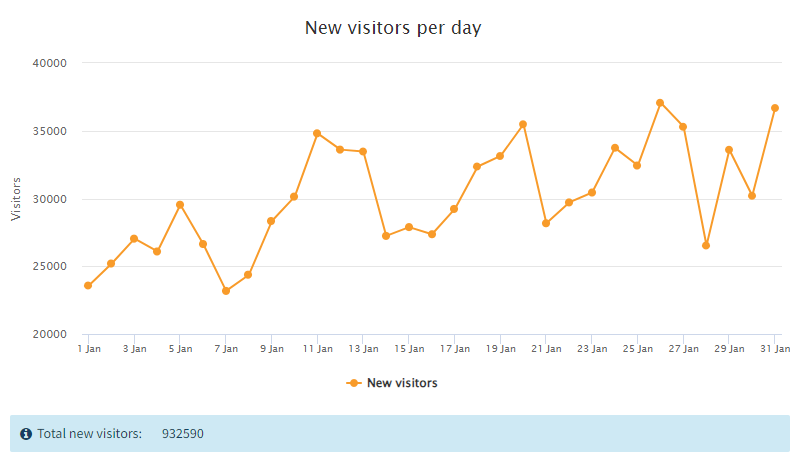
New visitors per day
The New visitors per day chart plots the number of daily new visitors over the selected time range.
Below the chart, you can view the total number of new visitors for the entire selected time range.
Exporting statistics for daily returning and new visitors
You can export statistics for daily returning and new visitors to a Microsoft Office Open XML Workbook (XLSX) file.
To export the statistics:
-
In the Frosmo Control Panel, in the sidebar, select More > All Reports.
-
Select the Retention tab.
-
Define the time range and filtering for the statistics. For more information, see steps 3 and 4 in Viewing statistics for daily returning and new visitors.
-
Click Download report. Your browser downloads the XLSX file containing the statistics.
Visitors in segments
You can view a variety of statistics for each segment, including:
-
Number of visitors in a segment
-
Conversions and conversion rate by segment
-
Revenue created by a segment
For more information, see Segment statistics.
Visitors in affinity groups
You can view the number of visitors in each affinity group tracked for your site. For more information, see Affinity group statistics.
Visitor statistics for modifications
You can view key visitor metrics for each modification variation. For more information, see Basic modification statistics.
Visitor explorer and visitor profiles
You can use the visitor explorer to browse the visitors tracked for your site and view an individual visitor's interaction profile. You can also preview recommendation, search, and Smart Discovery results for a visitor. For more information, see Visitor explorer.