Segment statistics
You can view and export segment statistics for a site in the Frosmo Control Panel.
Use the statistics to:
-
View the number of visitors in segments and see how the segment sizes have evolved over time.
-
View the number of converted visitors and the conversion rate per segment.
-
View the amount of revenue generated by visitors per segment.
-
Check how many visitors in a segment have been exposed to modifications.
Conversions include both transactions and non-purchase conversions.
You can quickly check the most important business performance statistics in the site dashboard.
Viewing segment statistics
To view segment statistics:
-
In the Frosmo Control Panel, in the sidebar, select More > All Reports.
-
Select the Segments tab.
-
Optionally, to filter the segments by name and group name, enter the name in the search field. The segments list automatically updates to show only segments whose name or group name matches what you have entered.

-
Optionally, click Show additional columns to view the following visitor statistics:
-
Added
-
Exited (expired)
-
ACPPU
-
ACPUU
-
ARPPU
-
ARPUU

To hide the statistics again, click Hide additional columns.
-
-
Define the time range over which you want to view the statistics:
-
Daily view: Select Day, and use the date picker to select the day.
-
Weekly view: Select Week, and use the date picker to select any date from the week that you want to view. If you select a date that is not a Monday, the date field automatically sets itself to the Monday of the selected week.
-
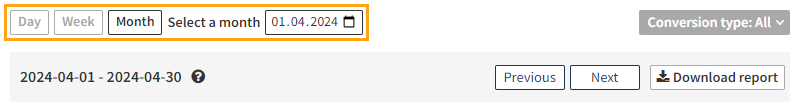
Monthly view: Select Month, and use the date picker to select any date from the month that you want to view. If you select a date other than the 1st, the date field automatically sets itself to the 1st of the selected month.
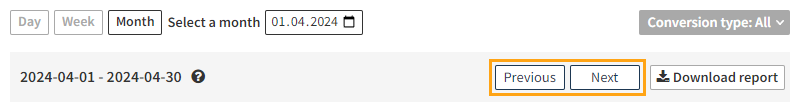
To view the statistics for an adjacent day, week, or month, click Previous or Next.
 info
infoIn the Frosmo Platform, for statistics purposes, a week starts on Monday at 00:00:00 and ends on Sunday at 23:59:59, while a month starts on the 1st of the month at 00:00:00 and ends on the last day of the month at 23:59:59.
The times always use the time zone of your Frosmo Platform instance. Your current time zone may therefore differ from the time zone that the statistics use.
-
-
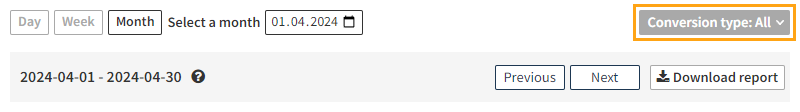
In the Conversion type field, select the conversion type for which to view the statistics. To only view transaction statistics, select Transaction. To view the combined statistics for all conversion types, select All.
-
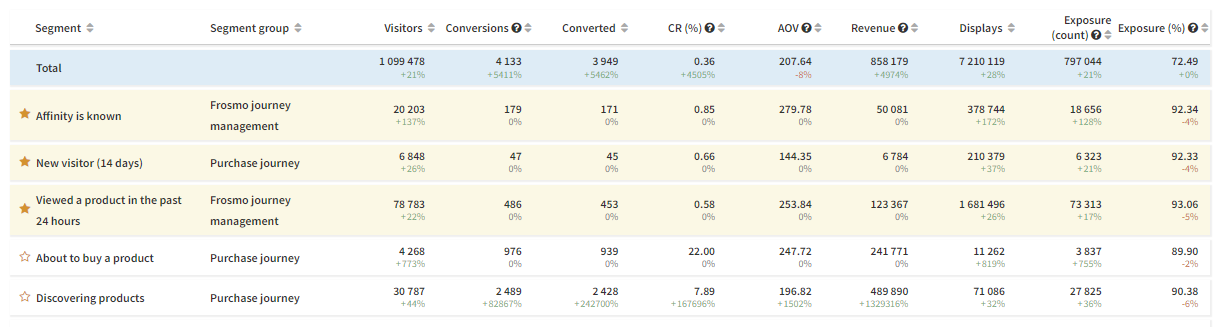
Study the statistics:
-
Visitors: Number of visitors in the segment during the selected time range. The number includes both visitors who entered the segment before the time range and visitors who entered the segment during the time range.
-
Added: Number of visitors who entered the segment during the selected time range. If the same visitor entered, exited, and re-entered the segment during the selected time range, the platform counts each entry.
-
Exited (expired): Number of unique visitors who exited the segment during the selected time range. The number in parentheses is the number of visitors who exited the segment because the segment's time limit elapsed for them and the platform removed them from the segment. If the same visitor exited, entered, and re-exited the segment during the selected time range, the platform counts each exit.
-
Conversions: Number of conversions completed by all visitors in the segment during the selected time range. If the same visitor completes 10 conversions, the total goes up by 10.
-
Converted: Number of visitors in the segment who completed a conversion during the selected time range. If the same visitor completed multiple conversions during the selected time range, the platform counts the visitor just once.
-
CR (%): Conversion rate. Percentage of visitors in the segment who completed a conversion during the selected time range.
-
ACPPU: Average conversions per paying user. ACPPU measures the average number of conversions completed by those visitors in the segment who completed at least one conversion during the selected time range. The visitors are unique visitors.
-
ACPUU: Average conversions per unique user. ACPUU measures the average number of conversions completed by all visitors in the segment during the selected time range. The visitors are unique visitors and include both converted and non-converted visitors.
-
AOV: Average order value. The AOV is calculated as the total revenue generated by visitors in the segment divided by the number of conversions completed by visitors in the segment.
-
Revenue: Total combined revenue generated by visitors in the segment during the selected time range. The revenue is calculated from the total purchase value (rather than from the individual item prices) recorded in the transactions made by the visitors.
-
ARPPU: Average revenue per paying user. ARPPU measures the average revenue generated by the converted visitors in the segment during the selected time range. The visitors are unique visitors.
-
ARPUU: Average revenue per unique user. ARPUU measures the average revenue generated by all visitors in the segment during the selected time range. The visitors are unique visitors and include both converted and non-converted visitors.
-
Displays: Number of modifications displayed to visitors in the segment during the selected time range.
-
Exposure (count): Number of visitors in the segment for whom at least one modification variation loaded and rendered during the selected time range.
-
Exposure (%): Percentage of visitors in the segment for whom at least one modification variation loaded and rendered during the selected time range.
 tip
tipYou can sort the segments by name, group name, or individual statistic. Featured segments are shown at the top of the segments list and sorted only in relation to each other.
-
Exporting segment statistics
You can export segment statistics to a Microsoft Office Open XML Workbook (XLSX) file.
To export the statistics:
-
In the Frosmo Control Panel, in the sidebar, select More > All Reports.
-
Select the Segments tab.
-
Define the time range and conversion type for the statistics. For more information, see steps 5 and 6 in Viewing segment statistics.
infoFiltering the segments by name and group name does not apply to the export. The export always includes all the segments. In addition, the export always includes all the available statistics (same as clicking Show additional columns).
-
Click Download report. Your browser downloads the XLSX file containing the statistics.
Managing featured segments
You can promote any segment to a featured segment in segment statistics. Featured segments are shown at the top of the segments list both on the segment statistics page and in exports. You can have as many featured segments as you need.
Featured segments are a global site setting in the Frosmo Platform. If you promote a segment to featured, every user with access to the site in the Frosmo Control Panel will see the segment as a featured segment. Any user can also demote the segment to a regular segment.
To promote a segment to featured:
-
In the Frosmo Control Panel, in the sidebar, select More > All Reports.
-
Select the Segments tab.
-
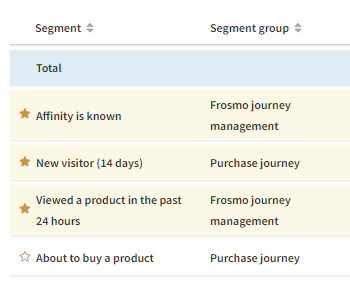
In the segments list, click the star icon for the segment that you want to promote to featured.
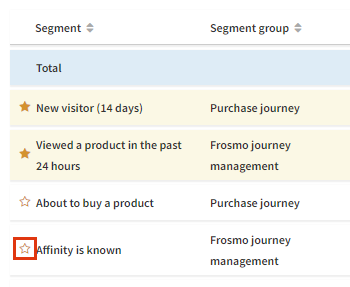
The segment moves to the top of the list, sorted in relation to the other featured segments.
To demote the segment to a regular segment, click the star icon again.