Recommendation statistics
You can view the statistics for strategy-based recommendations in the Frosmo Control Panel.
Use the statistics to:
-
Monitor the overall performance of recommendations on your site.
-
Quickly check the conversion rate and other key metrics for a recommendation.
-
Compare items in a recommendation to see how they are performing.
The statistics are based on performance data that the Frosmo Platform automatically tracks for recommendations.
Based on the conversion attribution model used by the Frosmo Platform in transaction tracking:
-
The time range for attribution is 30 days. This means that a purchase must take place within 30 days after clicking a recommendation in order to be attributed to the recommendation.
-
A click can also take place prior to the selected time range, if the purchase date is within the time range (and the purchase is attributed to the click). For example:
-
You view the statistics on 2022-12-31, and the selected time range is 30 days (from 2022-12-01 to 2022-12-30).
-
A visitor has clicked an item in the recommendation on 2022-11-20.
-
The visitor has purchased the item on 2023-12-10.
-
Therefore, the purchase is attributed to the click even though the click took place prior to the selected time range.
-
To view the statistics for a recommendation:
-
In the Frosmo Control Panel, in the sidebar, select More > All Reports.
-
Select the Recommendations tab.
-
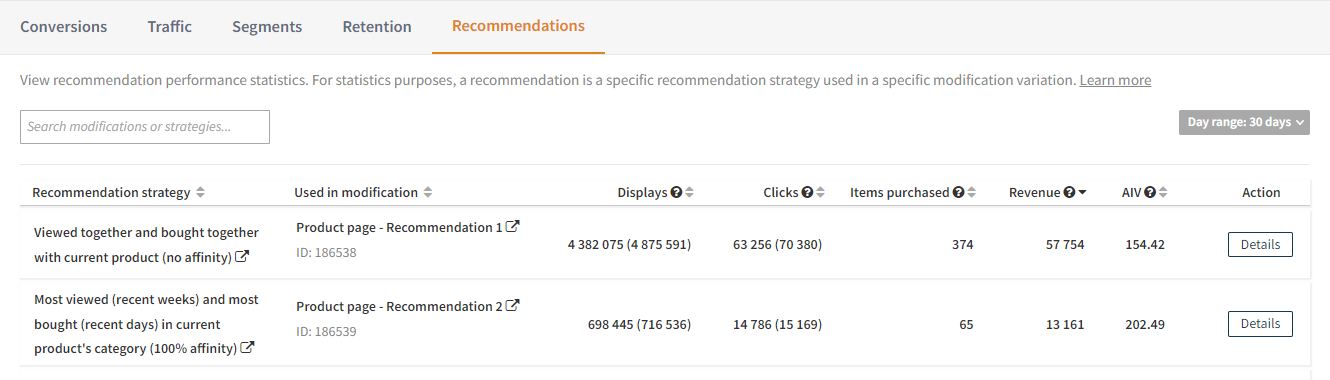
Optionally, to filter which recommendations to show, enter a search term in the search box. You can search by recommendation strategy or modification name. The Control Panel displays only strategies and modifications whose name contains the search term (ignoring case).
noteIn the statistics table, each row represents a single recommendation: a specific modification variation that uses a specific recommendation strategy for content. The statistics show how that strategy is performing in that particular modification and variation. Therefore, the same modification or strategy may appear in the table more than once.
If two or more variations of a modification use the same strategy, the statistics for the variations are combined.
-
In Day range, select the time range in days for which to display the statistics. The time range is counted from the previous day backwards. The default range is 30 days.
-
View the key statistics for the recommendation:
-
Displays: Total number of times that the recommendation has been displayed to visitors. The number in parentheses shows the total number of displays from the 30 days preceding the selected time range.
-
Clicks: Total number of times that items in the recommendation have been clicked. The number in parentheses shows the total number of clicks from the 30 days preceding the selected time range.
-
Items purchased: Total number of items purchased after clicking the items in the recommendation. For example, if a visitor clicks item A in the recommendation and proceeds to purchase 3 units of item A, the total number of purchased items for the recommendation increases by 3.
-
Revenue: Total revenue generated from purchases made after clicking the items in the recommendation. For example, if a visitor clicks item A in the recommendation and proceeds to purchase 500 euros worth of item A, the total revenue generated by the recommendation increases by 500.
-
AIV: Average item value. Average value of the items purchased after clicking the items in the recommendation.
 tip
tipTo open the settings for a recommendation strategy or modification, click the strategy or modification name.
-
-
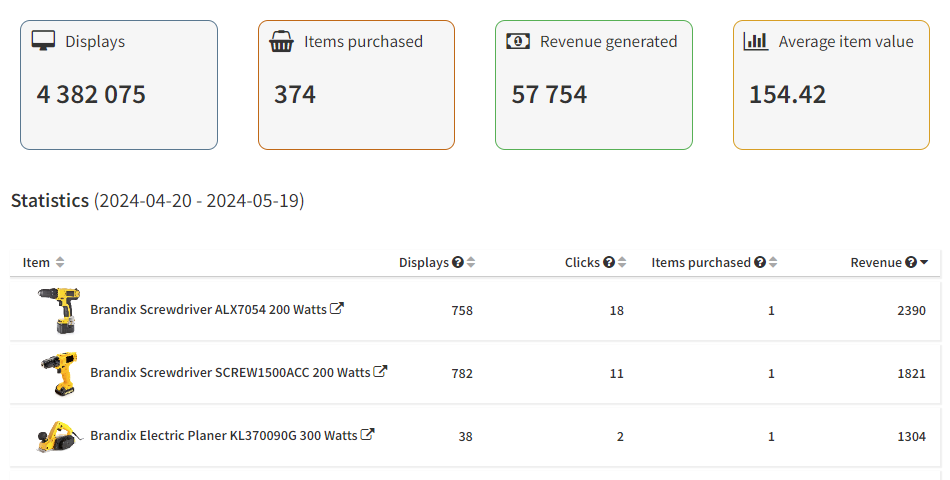
To view detailed statistics for each item in the recommendation, click Details for the recommendation whose detailed statistics you want to view. The detailed statistic view opens.
infoThe list shows detailed statistics for the top 500 items in the recommendation by revenue.
-
View the statistics for the recommendation:
-
Displays: Total number of times that the recommendation has been displayed to visitors.
-
Items purchased: Total number of items purchased after clicking the items in the recommendation. For example, if a visitor clicks item A in the recommendation and proceeds to purchase 3 units of item A, the total number of purchased items for the recommendation increases by 3.
-
Revenue generated: Total revenue generated from purchases made after clicking the items in the recommendation. For example, if a visitor clicks item A in the recommendation and proceeds to purchase 500 euros worth of item A, the total revenue generated by the recommendation increases by 500.
-
Average item value: Average value of the items purchased after clicking the items in the recommendation.
-
-
View the statistics for each item in the recommendation:
-
Displays: Total number of times that the item has been displayed to visitors in the recommendation.
-
Clicks: Total number of times that the item has been clicked in the recommendation.
-
Items purchased: Total number of items purchased after clicking the item in the recommendation. For example, if a visitor clicks item B in the recommendation and proceeds to purchase 2 units of item B, the total number of purchased item Bs for the recommendation increases by 2.
-
Revenue: Total revenue generated from purchases of the item made after clicking the item in the recommendation. For example, if a visitor clicks item B in the recommendation and proceeds to purchase 200 euros worth of item B, the total revenue generated by item B for the recommendation increases by 200.
-