Business performance statistics
You can view the most important business performance statistics for your site in the site dashboard.
Use the statistics to:
-
View the revenue generated by the Frosmo Platform on the site.
-
View the personalization coverage (the percentage of visitors exposed to modifications) on the site.
-
Monitor the trends in the personalization coverage and Frosmo-generated revenue on the site.
-
For retail sites, monitor visitor insights based on affinity and check which Frosmo features are enabled for the site.
The statistics exclude visitor interactions with workspace modifications. For example, if a visitor clicks a workspace modification on the site, the click is not registered in the statistics.
The available business performance statistics depend on the business vertical of your site:
You can also view detailed performance statistics for your site.
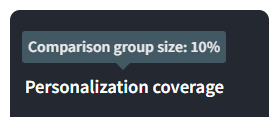
To view the current comparison group size for your site, hover your mouse cursor over Personalization coverage.
Viewing business performance statistics for an iGaming site
The redesigned dashboard must be separately enabled for each iGaming site. If you want to start using the new dashboard, contact Frosmo support.
To view the statistics:
-
In the Control Panel, in the sidebar, select Dashboard.
-
In the time range menu, select the month for which you want to view the statistics.
noteSome of the statistics, such as personalization coverage, are only available for complete months. This means that you cannot view the statistics for the current month.
-
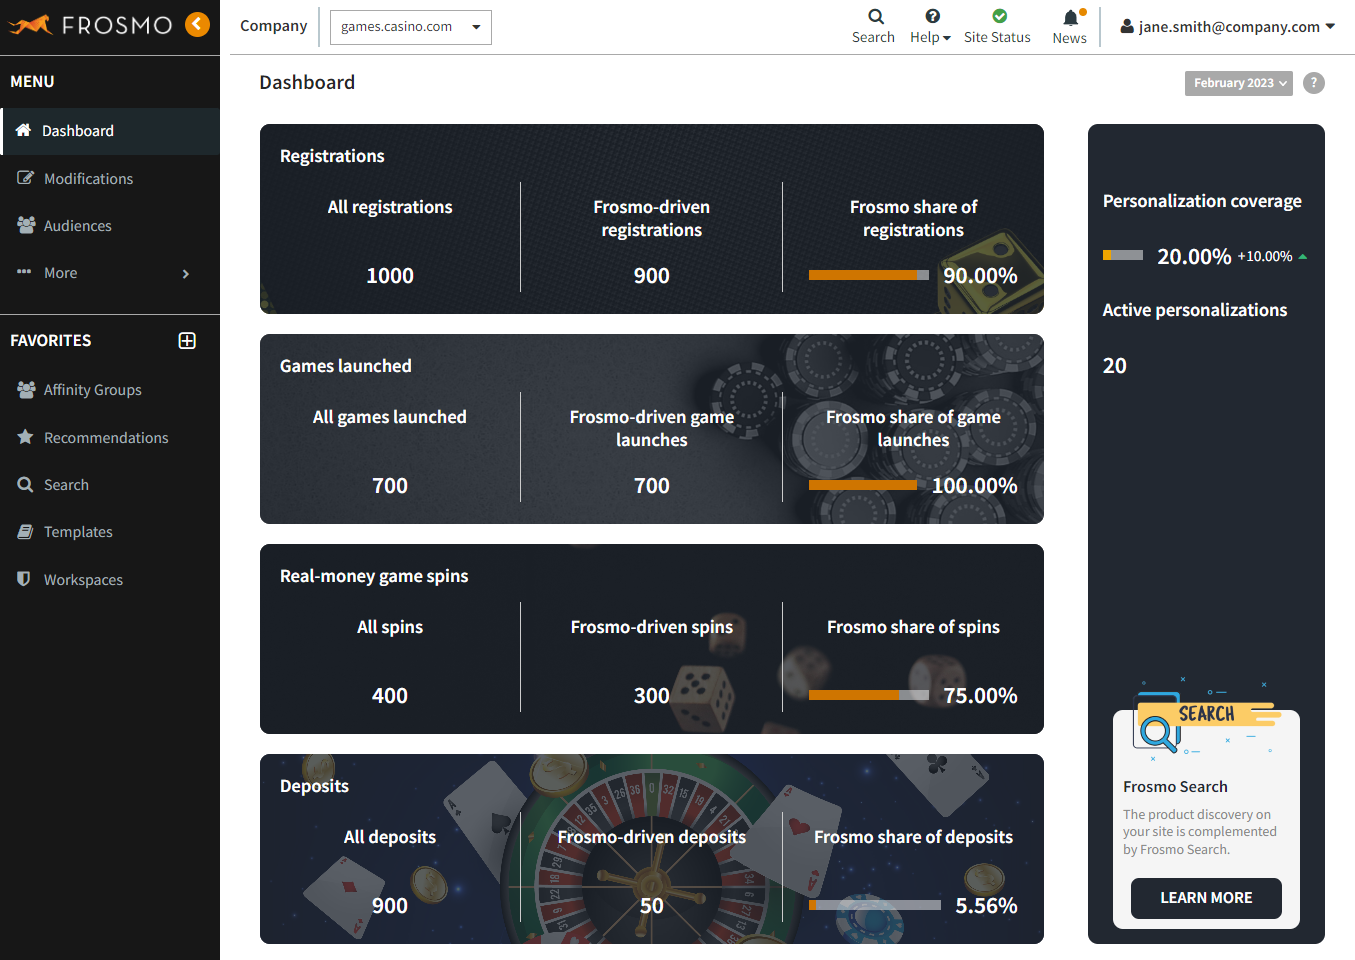
View the statistics for the site for the selected month:
-
Personalization coverage: Percentage of visitors who saw modifications. The number is based on true displays, and only includes modifications with visible content. In addition, modifications displaying original content to the comparison group are not counted). The dashboard also displays the change in the personalization coverage as compared to the previous month.
-
Active personalizations: Number of active modifications running on the site.
-
Registrations:
-
All registrations: Total number of visitor registrations on the site.
-
Frosmo-driven registrations: Registrations that occurred after a visitor clicked a modification anywhere on the site. This is the total number of registrations driven by the Frosmo Platform.
-
Frosmo share of registrations: Percentage of the registrations that were driven by the Frosmo Platform.
-
-
Games launched:
-
All games launched: Total number of game launches on the site.
-
Frosmo-driven game launches: Game launches that occurred after a visitor clicked a modification anywhere on the site. This is the total number of game launches driven by the Frosmo Platform.
-
Frosmo share of game launches: Percentage of the game launches that were driven by the Frosmo Platform.
-
-
Real-money game spins:
-
All spins: Total number of game spins on the site.
-
Frosmo-driven spins: Game spins that occurred after a visitor clicked a modification anywhere on the site. This is the total number of game spins driven by the Frosmo Platform.
-
Frosmo share of spins: Percentage of the game spins that were driven by the Frosmo Platform.
-
-
Deposits:
-
All deposits: Total number of deposits on the site.
-
Frosmo-driven deposits: Deposits that occurred after a visitor clicked a modification anywhere on the site. This is the total number of deposits driven by the Frosmo Platform.
-
Frosmo share of deposits: Percentage of the deposits that were driven by the Frosmo Platform.
-
-
Viewing business performance statistics for a retail site
For a retail site, you can view the following statistics:
You can also check which Frosmo web and omnichannel features are enabled for the site.
You can view visitor insights and check Frosmo features only if the affinity feature is enabled for the site. To enable the feature, if it's not already enabled, contact Frosmo support.
Viewing Frosmo performance statistics
To view the statistics:
-
In the Control Panel, in the sidebar, select Dashboard.
-
In the time range menu, select the month for which you want to view the statistics.
noteSome of the statistics, such as revenue changes and personalization coverage, are only available for complete months. This means that you cannot view the statistics for the current month.
-
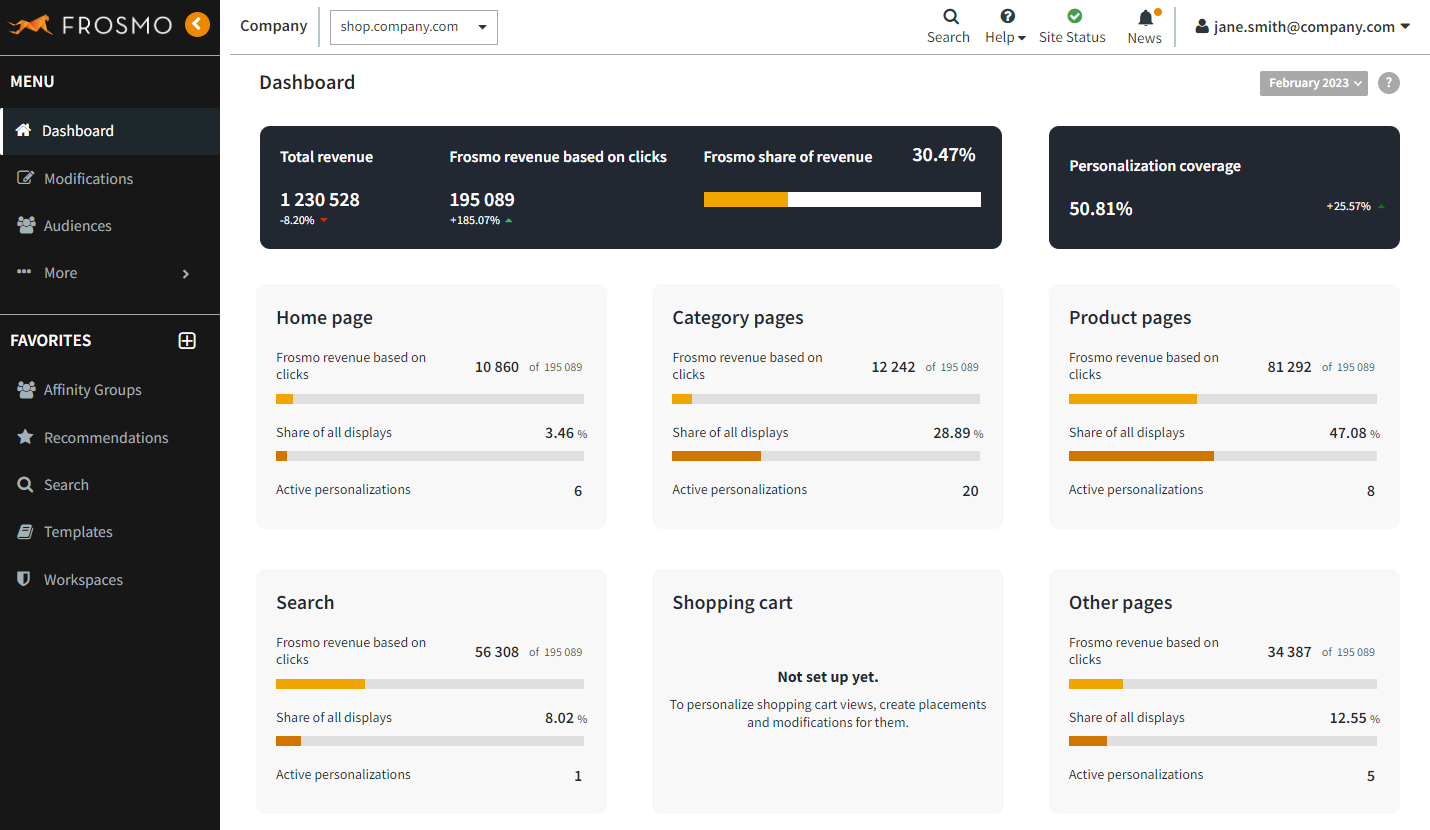
View the key statistics for the site for the selected month:
-
Total revenue: Total revenue generated by transactions tracked on the site. The dashboard also displays the change in the revenue as compared to the previous month.
-
Frosmo revenue based on clicks: Revenue generated by transactions that occurred after a visitor clicked a modification anywhere on the site. This is the total revenue generated by the Frosmo Platform. The dashboard also displays the change in the Frosmo-generated revenue as compared to the previous month.
-
Frosmo share of the revenue: Percentage of the total revenue that was generated by the Frosmo Platform.
-
Personalization coverage: Percentage of visitors who saw modifications. The number is based on true displays, and only includes modifications with visible content. In addition, modifications displaying original content to the comparison group are not counted). The dashboard also displays the change in the personalization coverage as compared to the previous month.
-
-
View the statistics by page type for the selected month:
-
Frosmo revenue based on clicks: Revenue generated by transactions that occurred after a visitor clicked a modification on a page of this type.
-
Share of all displays: Percentage of all true displays that occurred on pages of this type.
-
Active personalizations: Number of active modifications assigned to pages of this type.
The following table describes how the statistics are calculated for each page type.
Page type Description Home page
Statistics for all pages on the site with placements using the Home page type. Normally there is only a single page on a site with such placements.
Category pages
Combined statistics for all pages on the site with placements using the Category page type.
Product pages
Combined statistics for all pages on the site with placements using the Product page type.
Search
Combined statistics for all pages and views on the site with placements using the Search page type. This can include, for example, the Instant Search box and search results page.
Shopping cart
Combined statistics for all pages and views on the site with placements using the Cart page type.
Other pages
Combined statistics for all pages on the site with placements using the Other page type, and pages with placements for which no page type has been defined.
noteThe Brand page type is not included in the Other pages statistics.
-
To view a more detailed statistic summary for the site, click View more statistics.
Viewing visitor insights based on affinity
To view the affinity statistics:
-
In the Control Panel, in the sidebar, select Dashboard, and scroll down to Visitor insights based on affinity data.
-
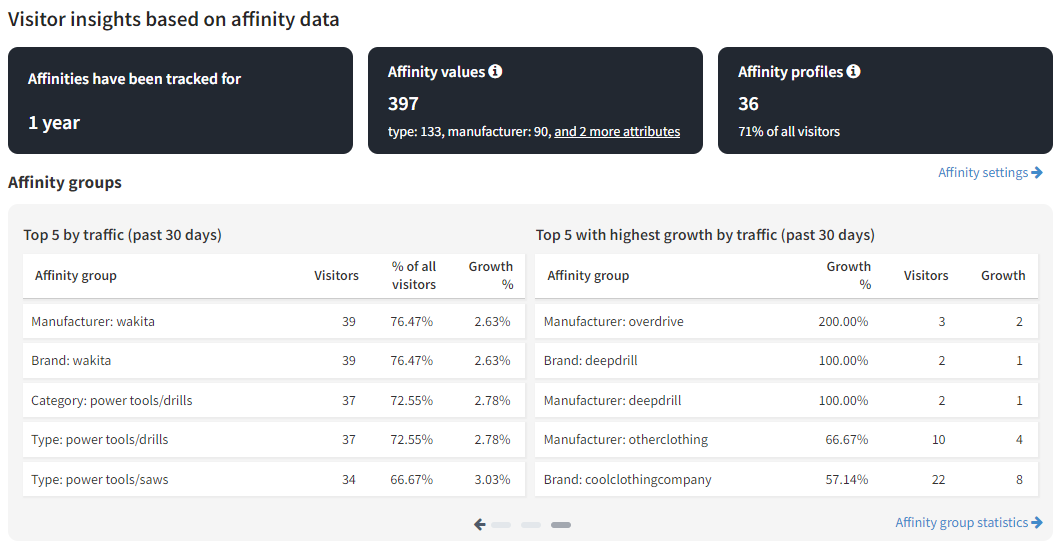
View the key statistics for the site:
-
Affinities have been tracked for: Time during which visitor affinities have been tracked for the site.
-
Affinity values: Total number of affinity values tracked on the site and the number of affinity values for each tracked attribute. The numbers have been accumulated over the time during which visitor affinities have been tracked.
-
Affinity profiles: Number of active affinity profiles on the site during the past 30 days and the percentage of all visitors who are included in any of the profiles.
To edit affinity interaction and attribute weights, and to preview affinity scores, select Affinity settings.
-
-
View the affinity group statistics. Use the arrows at the bottom of the statistics table to change the view.
-
Top 5 by revenue (past 30 days):
-
Revenue generated by all transactions completed by visitors in the affinity group
-
Percentage of all revenue generated by transactions completed by visitors in the affinity group
-
Growth in the revenue generated by transactions completed by visitors in the affinity group compared to the previous 30 days
-
-
Top 5 with highest growth by revenue (past 30 days):
-
Growth in the revenue generated by transactions completed by visitors in the affinity group compared to the previous 30 days as a percentage
-
Revenue generated by all transactions completed by visitors in the affinity group
-
Growth in the revenue generated by transactions completed by visitors in the affinity group compared to the previous 30 days as a monetary value
-
-
Top 5 by conversions (past 30 days):
-
Conversions completed by visitors in the affinity group
-
Percentage of all conversions completed by visitors in the affinity group
-
Growth in the conversions completed by visitors in the affinity group compared to the previous 30 days
noteConversions include both transactions and non-purchase conversions.
-
-
Top 5 with highest growth by conversions (past 30 days):
-
Growth in the number of conversions completed by visitors in the affinity group compared to the previous 30 days as a percentage
-
Number of conversions completed by visitors in the affinity group
-
Growth in the revenue generated by transactions completed by visitors in the affinity group compared to the previous 30 days as an integer value
noteConversions include both transactions and non-purchase conversions.
-
-
Top 5 by traffic (past 30 days):
-
Number of visitors in the affinity group
-
Percentage of visitors in the affinity group from all site visitors
-
Growth in the number of visitors in the affinity group compared to the previous 30 days
-
-
Top 5 with highest growth by traffic (past 30 days):
-
Growth in the number of visitors in the affinity group compared to the previous 30 days as a percentage
-
Number of visitors in the affinity group
-
Growth in the number of visitors in the affinity group compared to the previous 30 days as an integer value
-
To view detailed statistics for each affinity group, click Affinity group statistics.
-
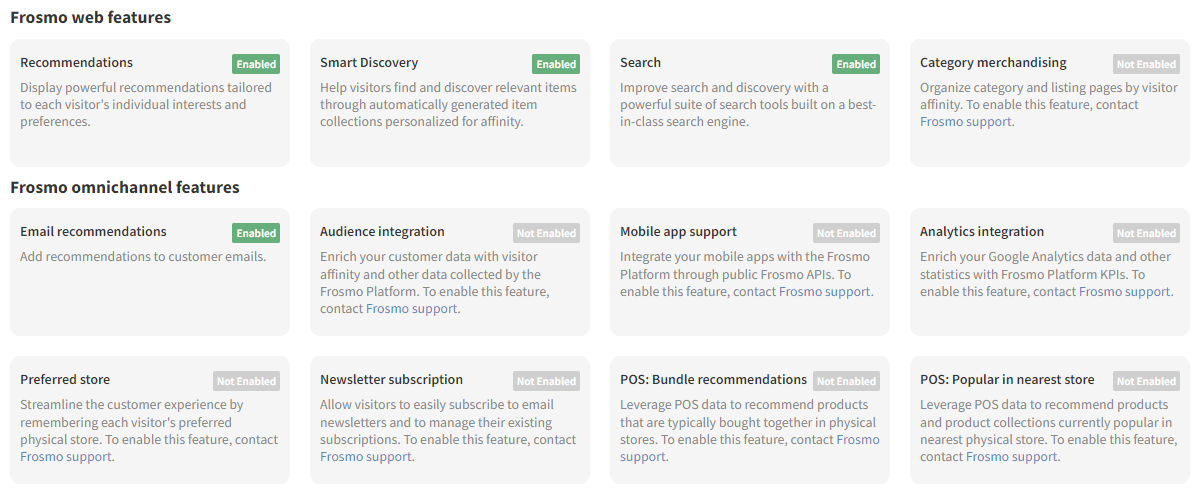
Checking the Frosmo features enabled for the site
To view the features:
-
In the Control Panel, in the sidebar, select Dashboard, and scroll down to the bottom of the view.
-
Check which Frosmo web features are enabled:
-
Recommendations: Create and display personalized product recommendations.
-
Smart Discovery: Create and display Smart Discoveries.
-
Search: Implement your site search with Frosmo Search.
-
Category merchandizing: Create category and listing pages and organize them by visitor affinity.
-
-
Check which Frosmo omnichannel features are enabled:
-
Email recommendations: Display product recommendations in your customer emails.
-
Audience integration: Enrich your customer data with visitor affinities and other data collected by the Frosmo Platform.
-
Mobile app support: Integrate your mobile apps with the Frosmo Platform through public Frosmo APIs.
-
Analytics integration: Enrich your Google Analytics data and other statistics with Frosmo Platform modification KPIs.
-
Preferred store: Remember each visitor's preferred physical store.
-
Newsletter subscription: Allow visitors to subscribe to email newsletters and to manage their existing subscriptions.
-
POS: Bundle recommendations: Integrate your point-of-sale (POS) data with the Frosmo Platform to display product recommendations based on products that are typically bought together in physical stores.
-
POS: Popular in nearest store: Integrate your point-of-sale (POS) data with the Frosmo Platform to display product recommendations and Smart Discoveries based on products that are currently popular in the physical stores nearest to visitors.
-
If there are features not enabled for your site, and you would like to enable them, contact Frosmo support.
Viewing detailed performance statistics for a site
To view a more detailed statistic summary for the site, click View more statistics at the bottom right corner of the page.
To view detailed statistics for different features, in the sidebar, select More > All Reports, and select the feature for which you want to view statistics. You can view, for example: