Affinity group statistics
You can view and export the affinity group statistics for a site in the Frosmo Control Panel.
Use the statistics to:
-
Get started with audience analysis for your site.
-
Discover promising new visitor segments for targeted content.
-
Gain a deeper insight into what interests your visitors.
On retail sites, to view the key visitor insights based on affinity, and to monitor affinity group performance, see Business performance statistics.
Viewing affinity group statistics
To view affinity group statistics:
-
In the Frosmo Control Panel, in the sidebar, select Audiences.
-
Select the Affinity Groups tab.
-
Optionally, filter the statistics:
-
Select the attributes whose affinity groups you want to display. To deselect an attribute, click its cross sign (×). To select an attribute, click its plus sign (+). By default, the page has all available attributes selected and therefore displays all affinity groups created for the site.
-
Conversion type: Select the conversion type for which to view the statistics. To only view transaction statistics, select Transaction. To view the combined statistics for all conversion types, select All.
-
Day range: Select the time range over which you want to view the statistics. You can either select a day range (up to the past 30 days) or a specific calendar month (within the past 6 months). For a day range, the time is counted from the previous day backwards. For a calendar month, the statistics cover the full month.

-
-
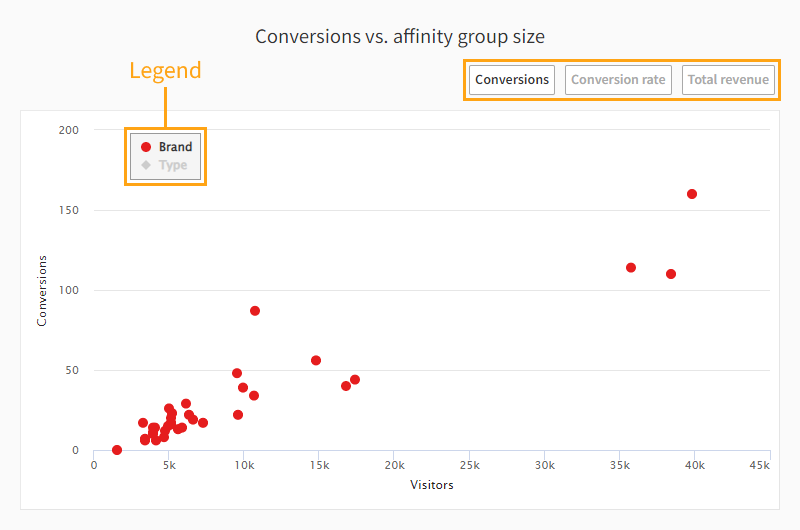
Study the scatter plot. The scatter plot visualizes the correlation between affinity group size (number of visitors, horizontal axis) and the selected statistic (vertical axis).
-
To select the statistic for the scatter plot, click the corresponding button: Conversions, Conversion rate, or Total revenue.
-
To select the attributes whose affinity groups you want to include in the scatter plot, click the attributes in the legend. Clicking an attribute toggles it from enabled (colored) to disabled (grayed out) and vice versa. When an attribute is disabled, its affinity groups are excluded from the scatter plot. By default, the scatter plot has all available attributes enabled.
-
To view the details of an affinity group, hover your mouse cursor over the corresponding dot in the scatter plot.
-
-
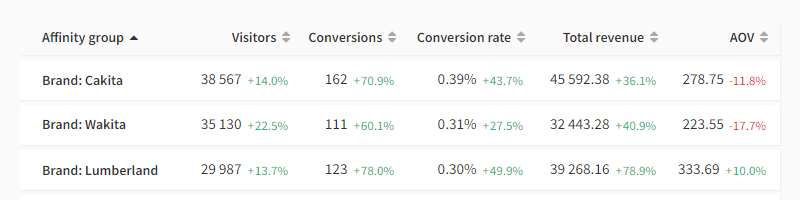
Study the statistics:
-
Visitors: Number of unique visitors in the affinity group during the selected time range. Even if a visitor was in the group only a portion of the selected time range, the Frosmo Platform still counts them as belonging to the group during the time range.
-
Conversions: Total number of conversions by visitors in the affinity group during the selected time range.
-
Conversion rate: Conversion Rate (CR) is the total number of converted visitors in the group divided by the total number of visitors in the group during the selected time range. Only unique visitors count.
-
Total revenue: Total combined revenue from the conversions during the selected time range.
noteThe revenue is in whatever currency is used in conversion and transaction tracking on the site. The Frosmo Platform treats currency values as just numbers, meaning the platform does not process the values as currency in any way. For example, if the site uses multiple currencies, the different currency values are mixed as is in the statistics; the platform does not convert the values to the same currency for the statistics.
-
AOV: Average order value (AOV) is the total revenue from visitors in the group divided by the total number of conversions by visitors in the group during the selected time range.
The percentages next to the values show the change from the previous time range.
 tip
tipYou can sort the statistics by affinity group name or individual statistic. Featured affinity groups are shown at the top of the list and sorted only in relation to each other.
-
You can assign modifications to the affinity groups for targeting purposes.
Exporting affinity group statistics
You can export affinity group statistics to a comma-separated values (CSV) file.
To export the statistics:
-
In the Frosmo Control Panel, in the sidebar, select Audiences.
-
Select the Affinity Groups tab.
-
Above the affinity groups list, click Download report. Your browser downloads the CSV file containing the statistics.
Managing featured affinity groups
You can promote any affinity group to a featured affinity group. Featured groups are shown at the top of the list on the affinity group statistics page. You can have as many featured groups as you need.
Featured affinity groups are a global site setting in the Frosmo Platform. If you promote a group to featured, every user with access to the site in the Frosmo Control Panel will see the group as a featured group. Any user can also demote the group to a regular affinity group.
To promote an affinity group to featured:
-
In the Frosmo Control Panel, in the sidebar, select Audiences.
-
Select the Affinity Groups tab.
-
In the affinity groups list, click the star icon for the group that you want to promote to featured.
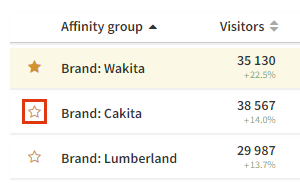
The group moves to the top of the list, sorted in relation to the other featured groups.
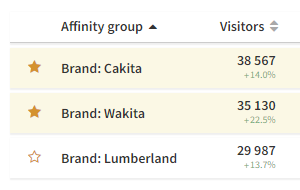
To demote the affinity group to a regular group, click the star icon again.