Troubleshooting shared code
If shared code is not working as expected, the reason is likely one of the following:
-
The code has not been activated. Only active code is executed. Activate the code.
-
The trigger attached to the code is not firing and the code is therefore never executed. The attached trigger might also not be the correct one. Check the trigger.
-
The code itself contains some fault that prevents it from working correctly on the site. Check the code.
While all modern browsers include a suite of developer tools, the selection of tools and their UIs differ between browsers. The following instructions use Google Chrome.
Checking the trigger
If the trigger's evaluation point occurs too early during page load, meaning before the firing conditions can be met, or if the trigger times out before the firing conditions can be met, the trigger does not fire, and the shared code attached to the trigger is never executed.
To check the trigger:
-
Make sure the shared code uses the correct trigger, and get the trigger ID:
-
In the Frosmo Control Panel, in the sidebar, select More > Shared Code.
-
In the shared code list, find the piece of shared code you want to check, and click the shared code name.
-
Click Select trigger.
-
Check the selected trigger:
-
If the selected trigger is not the correct one, select the correct trigger, click Confirm, and click Save. If the correct trigger does not exist, create the trigger, and then select the new trigger for the shared code. Continue to step 3.
-
If the selected trigger is the correct one, note its ID, and exit the shared code settings without saving by clicking Close and clicking Close again.
-
-
-
Check the trigger settings:
-
Review the settings. For example, make sure the trigger gets fired on the correct page(s).
-
Update the settings, if necessary.
-
Go to the site.
-
Check if the trigger is fired:
-
Open the browser console.
-
Go to a page where the shared code is executed.
-
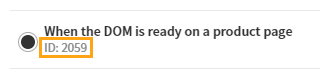
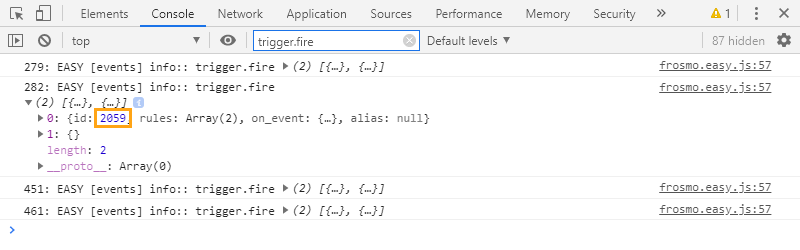
In the browser console, check for a
trigger.fireevent with the trigger ID. For more information about the event, see Console debugging with Frosmo Core.-
If you find the event, the trigger fired.
-
If you cannot find the event, the trigger did not fire. Continue to the next step.
-
tipYou can also use the event log in Frosmo Preview to check for Frosmo Platform events on a page.
-
-
Check the trigger evaluation flow:
-
In the browser console, check for trigger and other relevant events, and review their order. Filter the events as necessary. Frosmo Platform events are logged as
EASY [events].
-
If the trigger evaluation point is DOM element ready or JavaScript variable ready, check the console for a trigger timeout warning (an
EASY [trigger] warnmessage containing a timeout error and the IDs of the triggers attached to the timed-out event). If the trigger timed out, you may need to increase its timeout value.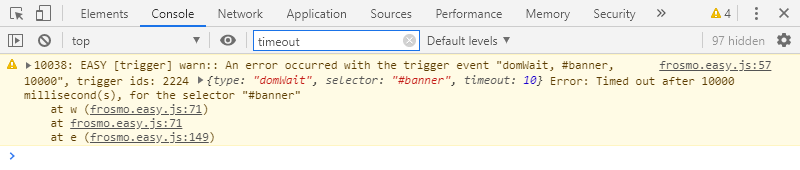
-
-
In the Control Panel, update the evaluation point settings for the trigger, if necessary.
Checking the code
To check the shared code:
-
Check the shared code ID:
-
In the Frosmo Control Panel, in the sidebar, select More > Shared Code.
-
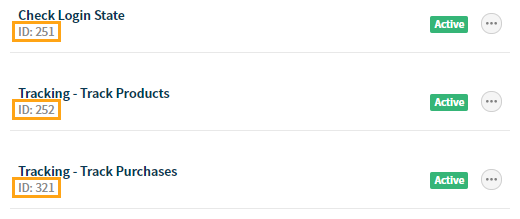
In the shared code list, find the piece of shared code you want to check, and note its ID.
-
-
Open the shared code settings, and review the shared code.
-
Go to the site.
-
Go to a page where the shared code is executed. If the shared code uses a trigger, perform the necessary actions to fire the trigger, so that the shared code is actually executed.
-
In the browser console, check for any errors thrown by the shared code.
-
Debug the shared code:
-
In the developer tools, open the source file search by pressing Ctrl+P (Windows) or Cmd+P (Mac).
-
In the search input, enter
frosmo_shared_code. The search lists the pieces of shared code that have been executed on the current page. The shared code files are namedfrosmo_shared_code_id_<id>_<index>, where<id>is the shared code ID.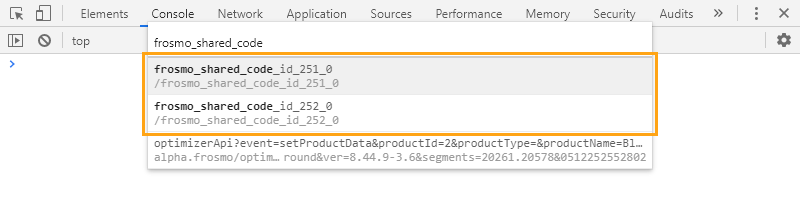 note
noteIf the shared code you want to debug is not in the search results, hard-reload the page to make sure the browser has the latest Frosmo custom script.
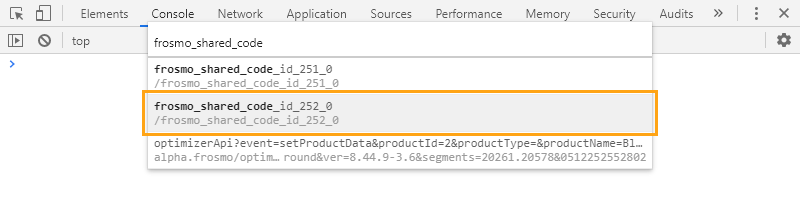
-
In the search results, select the shared code you want to debug. The shared code opens in the Sources tab.
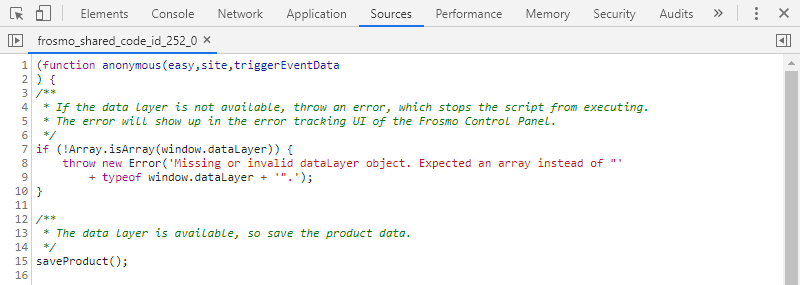
-
Start debugging the shared code. You can, for example, add breakpoints to the code and step through the code's execution to pinpoint problems. For more information about debugging JavaScript in the browser, see the browser documentation.
tipIf you're a Google Chrome user, see Get Started with Debugging JavaScript in Chrome DevTools.
-
-
In the Control Panel, update the shared code, if necessary.