Measuring and improving website performance
The focus of this article is on the technical performance of websites, which in this context means the site's speed and how much traffic it can handle. Technical performance is different from marketing performance, which can be measured using variables such as unique visitor traffic, returning visitors, bounce rate, and conversion rate.
The technical performance of a website has a profound effect on the user experience of the website visitors. However, the desired performance depends heavily on what kind of a website you have. An acceptable page load time for a retail web store can be much too slow when playing an online game.
Several factors affect the technical performance, such as the web server hosting the site, available bandwidth, web page design and structure, and, last but not least, factors you can't affect: visitor's location, device, and browser type.
Page loading process
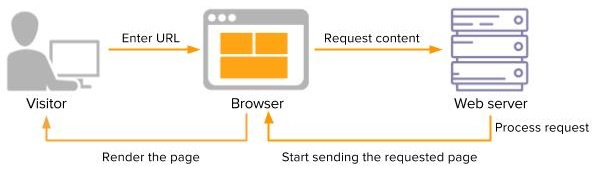
The page loading process, illustrated in a very simplified form in the following figure, begins when the visitor makes a request (for example, clicks a link or enters a URL in the browser address bar). The browser conveys the HTTP request to the web server, which processes the request and sends a response to the browser. The browser then parses, loads, and renders the page content, making it visible to the visitor. The visitor obviously only sees what happens (or doesn't happen) in the browser after the browser starts rendering the page content.
When the rendering starts, the browser first builds the page DOM (Document Object Model), which represents the HTML structure of the page, and starts downloading items defined in the page <head> element, such as CSS and JavaScript files.
When the page content starts to appear, HTML text elements are typically displayed first. This is often called "useful content display". Ideally, the visitor first sees the page header and navigation, immediately followed by content. By showing the visitor as much content to interact with as quickly as possible you improve the perceived performance of the site and, therefore, the chances that the visitor will stay on the page.
Graphics normally only appear after text and shouldn't therefore hold critical information.
Site performance metrics
You can use several metrics to measure the speed of a site, such as:
-
Connection time: Time between a visitor's request and the moment a connection is established between the visitor's browser and the origin server.
-
Time to first byte (TTFB): Time it takes for the first byte of data to reach a visitor's browser after a connection to the server has been established.
-
Time to title: Time between the instant a visitor requests a website and the moment the site's title shows up in the browser's tab or window bar.
-
Start render time: Time between a visitor's request and the moment when content starts appearing in their browser viewport.
-
Page load time: Number of seconds it takes to download and display the entire content of a page in the visitor's browser viewport. Page load time is arguably the most important performance metric.
Websites and applications that are quick to load have significantly better engagement and conversation rates. What, then, is a good response time? According to Jakob Nielsen, there are three important limits:
-
0.1-0.2 seconds: Operations that are completed in a couple of milliseconds feel instantaneous to the visitors. Visitors notice little to no delay.
-
Up to 1 second: One second is the maximum response time for the page behavior to feel immediate. The delay is noticeable but most visitors tolerate it easily.
-
5-10 seconds: If an operation takes more than 5 seconds, it exceeds the visitor's attention span, and the visitor starts to lose interest. After 10 seconds they have probably already opened another browser tab or left the website completely.
John Stevens from WebdesignerDepot.com states that in 2016 the desirable page load time was 0.5-2 seconds. Currently, the average load time is closer to 5 seconds, but according to Stevens, this just shows that most websites are not yet fully optimized for site speed.
Improving page load time
You can improve page load time in several ways, including:
-
Compressing and combining files to reduce the size of CSS, HTML, and JavaScript files
-
Minifying JavaScript and CSS, that is, removing redundant characters, comments, and white spaces
-
Avoiding redirects between pages and sites
-
Using content delivery networks (CDNs) to disperse the content and deliver it through the server that is fastest and closest to the visitor
-
Optimizing image sizes by, for example, not using unnecessarily large images that are then manually scaled in the HTML
-
Optimizing the placement of style sheets and external scripts so the page content appears as fast as possible
When monitoring and measuring site performance, note that it is greatly affected by the visitor's location, network connection, device, and browser.
Perceived performance
It's important to remember that the actual performance of the site may differ from the perceived performance. Perceived performance refers to how fast a visitor thinks your website is regardless of how fast it technically performs. While you should have an optimization strategy in place, you can also use different techniques to make your website feel faster and make its user experience more pleasant:
-
Strategically place animated spinners, progress bars, or other progress indicators on the page.
A progress indicator informs the visitor that even though there isn't much to see yet, something is happening and they can expect the content to show up soon. However, you should use especially spinners with caution as they may also make your visitors pay attention to the delay and thus impair the perceived performance.
-
Use lazy loading.
Lazy loading means delaying the loading of objects until the visitor needs them. For example, you only start loading an image on a page when the visitor scrolls down and the image becomes visible in their viewport. The page therefore loads faster and, in some cases, the server load is reduced.
-
Ensure that your web fonts, if any, are loaded before the actual content of the page.
There are several other methods you can use to increase both the actual and perceived performance of your site.
Frosmo and performance
To optimize performance, the Frosmo Platform uses CDNs to deliver the Frosmo JavaScript library and any Frosmo-specific media files used on websites. A CDN is a network of global servers connected to each other and used to store and deliver web content, such as images, videos, style sheets, and JavaScript files. When a visitor browses a website, the content of the site is delivered by the CDN server geographically closest to the visitor, decreasing page load time.
By default, the Frosmo JavaScript library files are delivered through Amazon CloudFront which serves the files using the CloudFront servers closest to the website visitor. Frosmo can also use other services based on customer requirements.
The Frosmo Platform uploads the custom script and associated media files (ones added directly to modifications) to the CDN every time they need to be updated, that is, every time something on your site is changed using the Control Panel. The assets are always exported to CloudFront and, when needed, copied from CloudFront to other CDNs.
The Frosmo scripts are optimized for performance, making the loading times generally faster than that of advertising scripts. The Frosmo Core library is very compact, only about 54 KB in size. The size of the custom script usually varies between 16-32 KB. To prevent the custom script from growing too large, make sure that you don't maintain unnecessary segments, placements, or modifications whose content is preloaded for your site. For more information about managing and removing items using the Frosmo Control Panel, see Working with segments, Placement workflow, and Modification workflow.
Working mainly with content procured by our customers means that Frosmo content modifications should not increase any overhead. Naturally, this depends on the type of content being used; high-definition images and videos are slower to load. When Frosmo is used to filter away (hide) existing content, Frosmo's optimized version of a website can be even faster than the original site.
Frosmo uses raw JavaScript instead of jQuery or other libraries such as Angular or React. Raw JavaScript works with all JavaScript-based libraries and can be up to 60 times faster than jQuery.